Already a member? Download this template in the member’s area
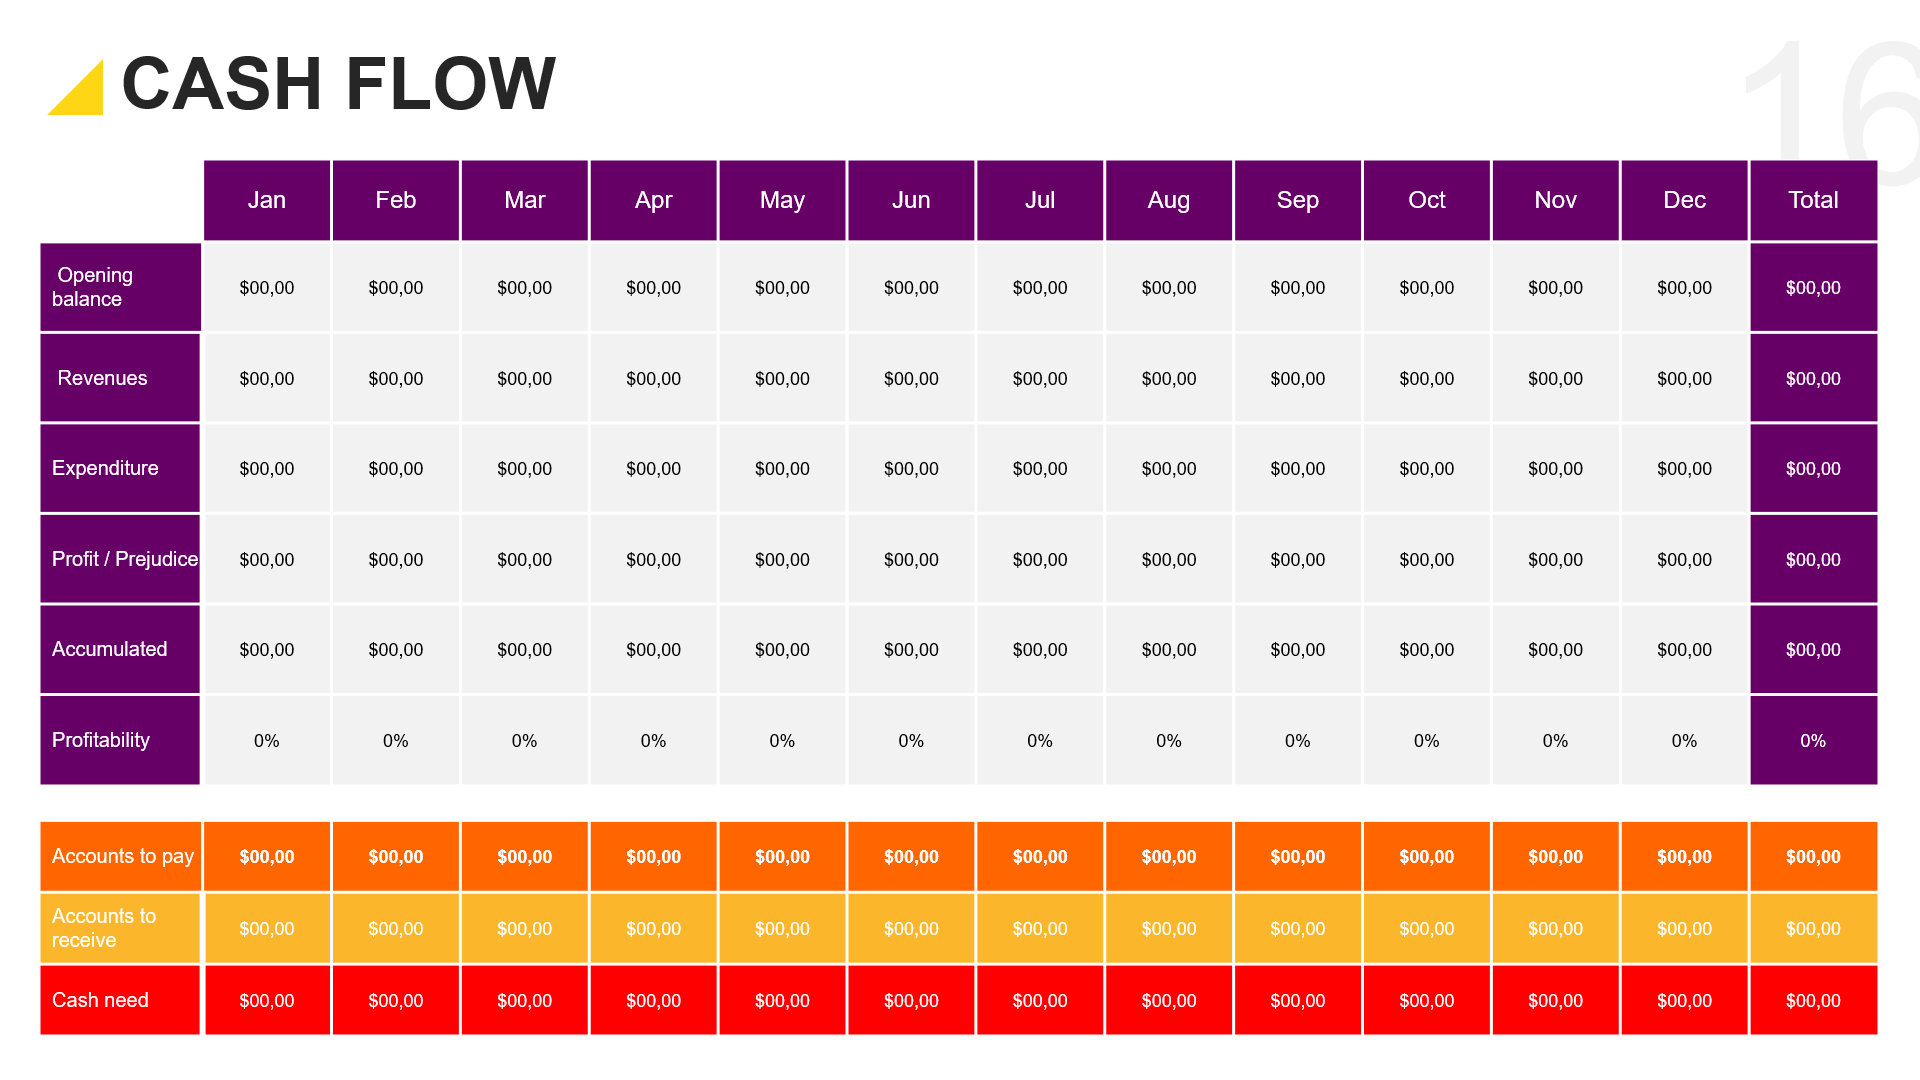
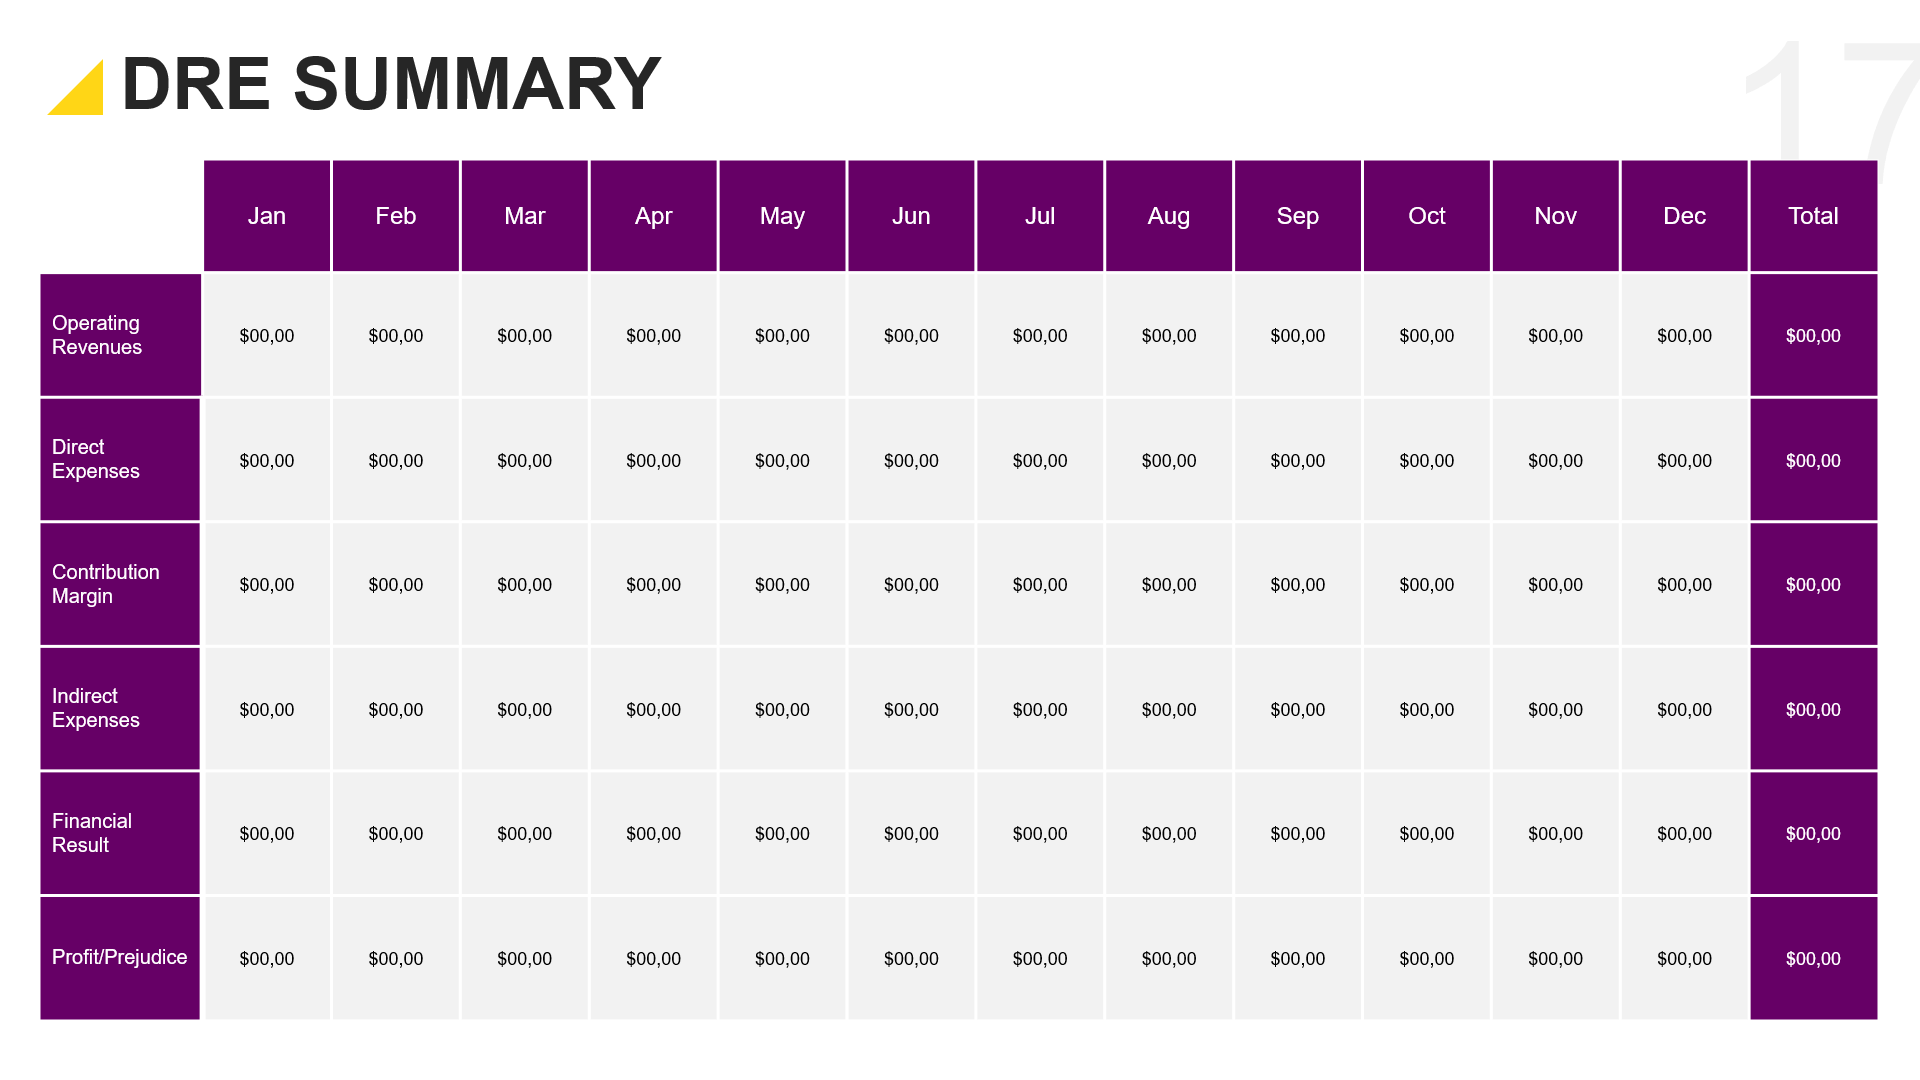
Presentation of Financial Charts in Powerpoint – FinGraph
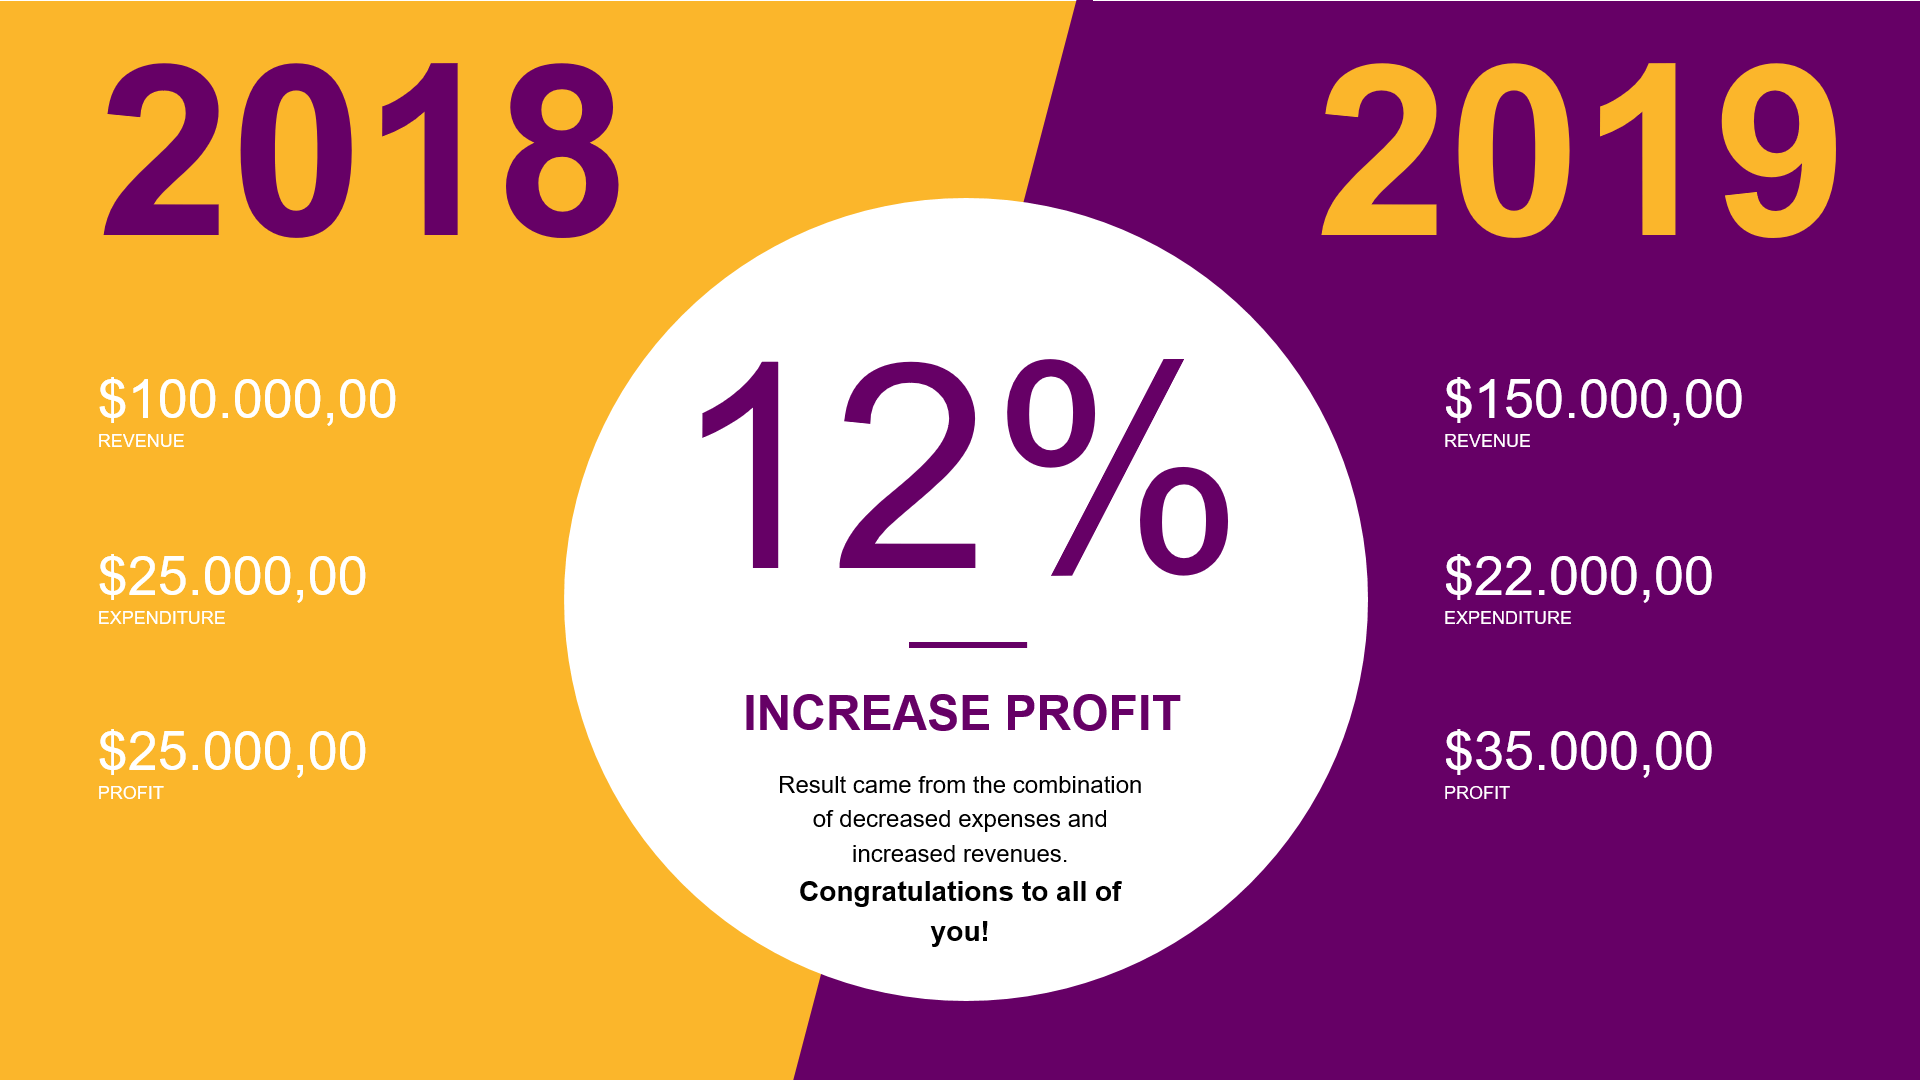
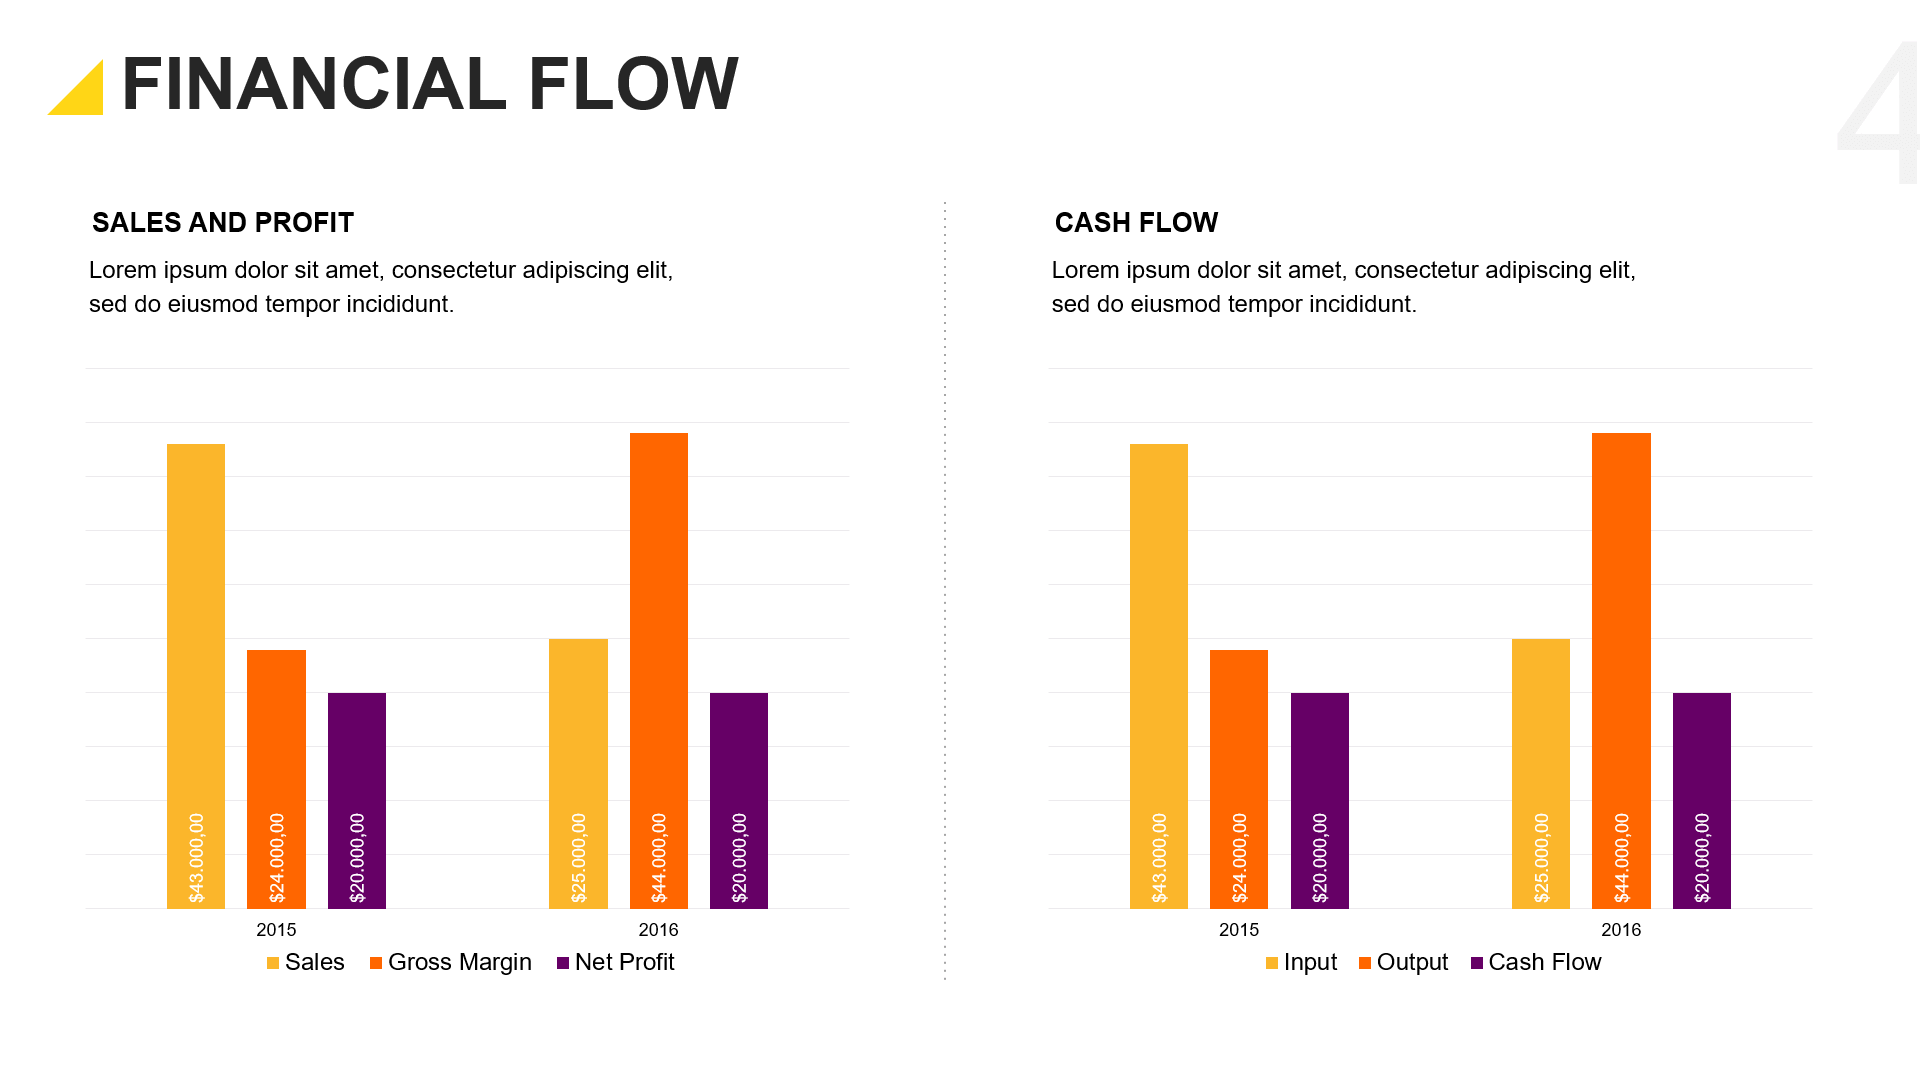
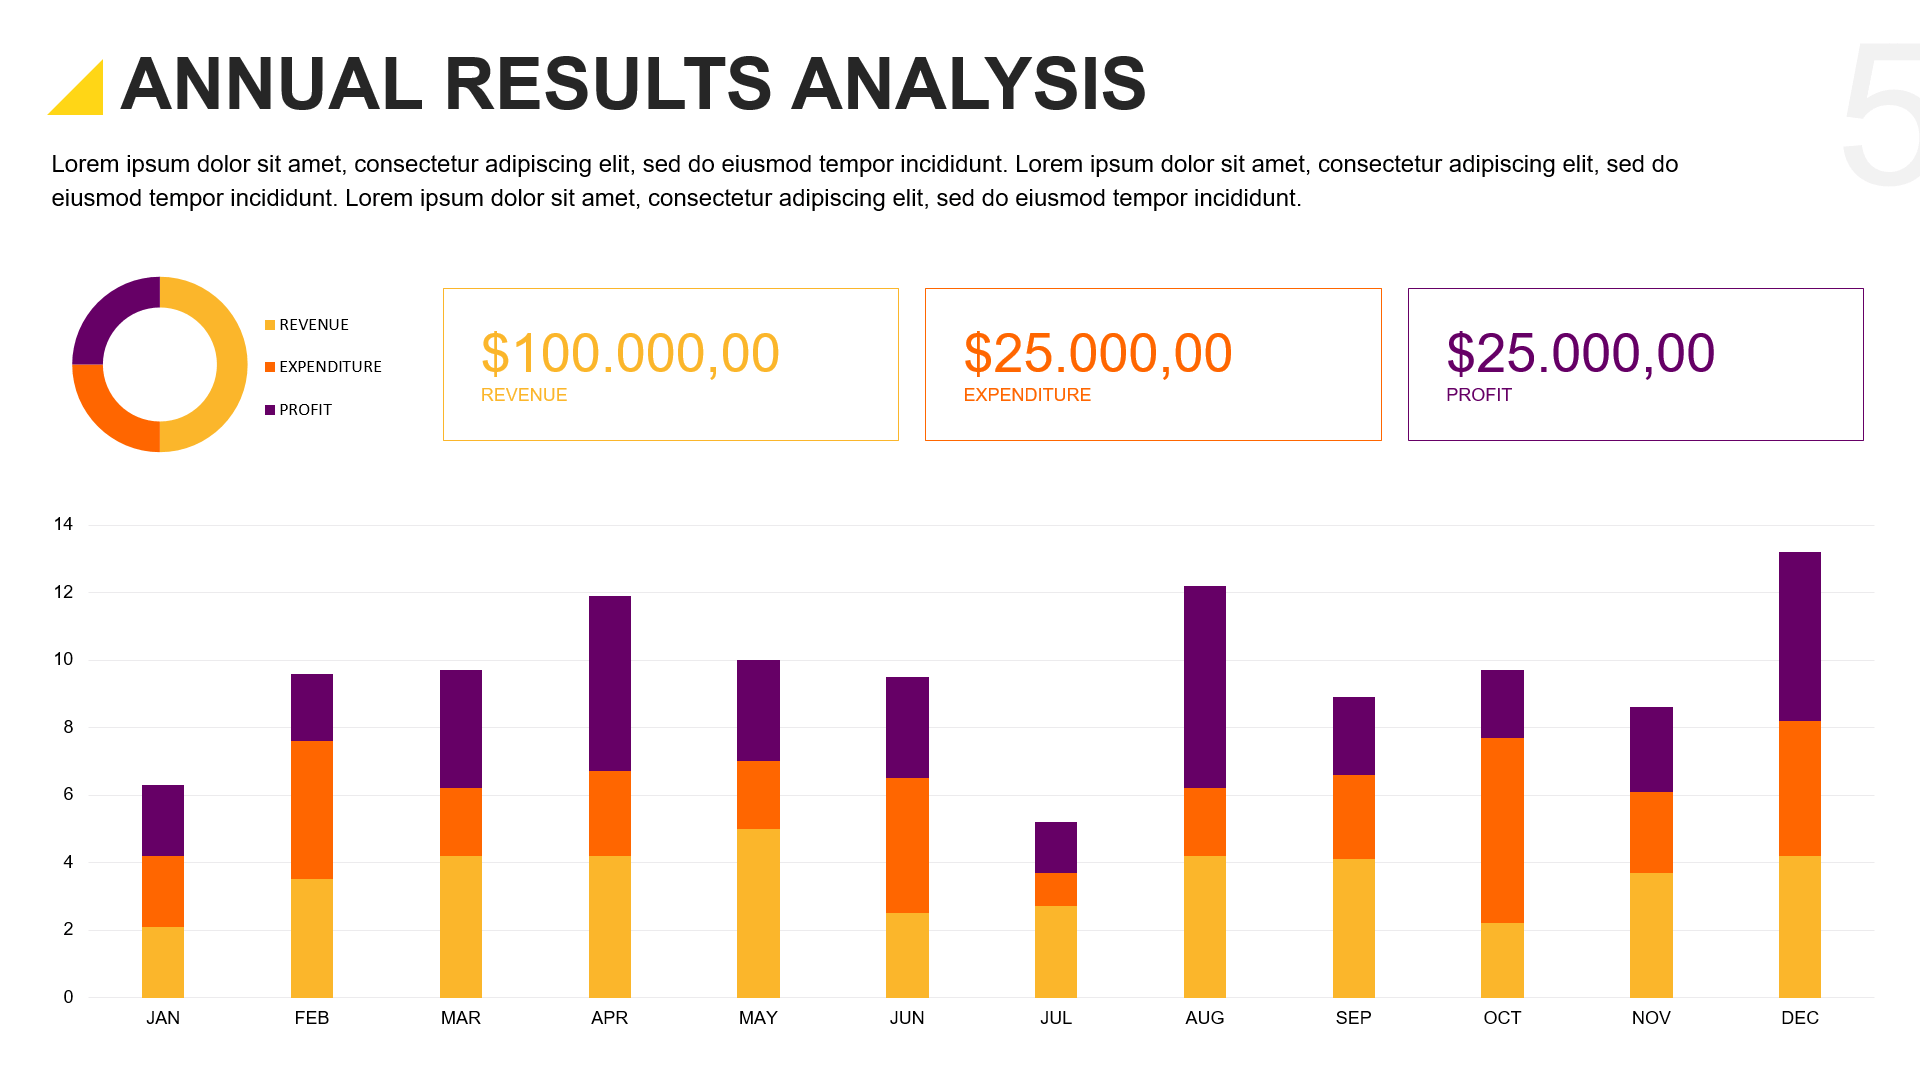
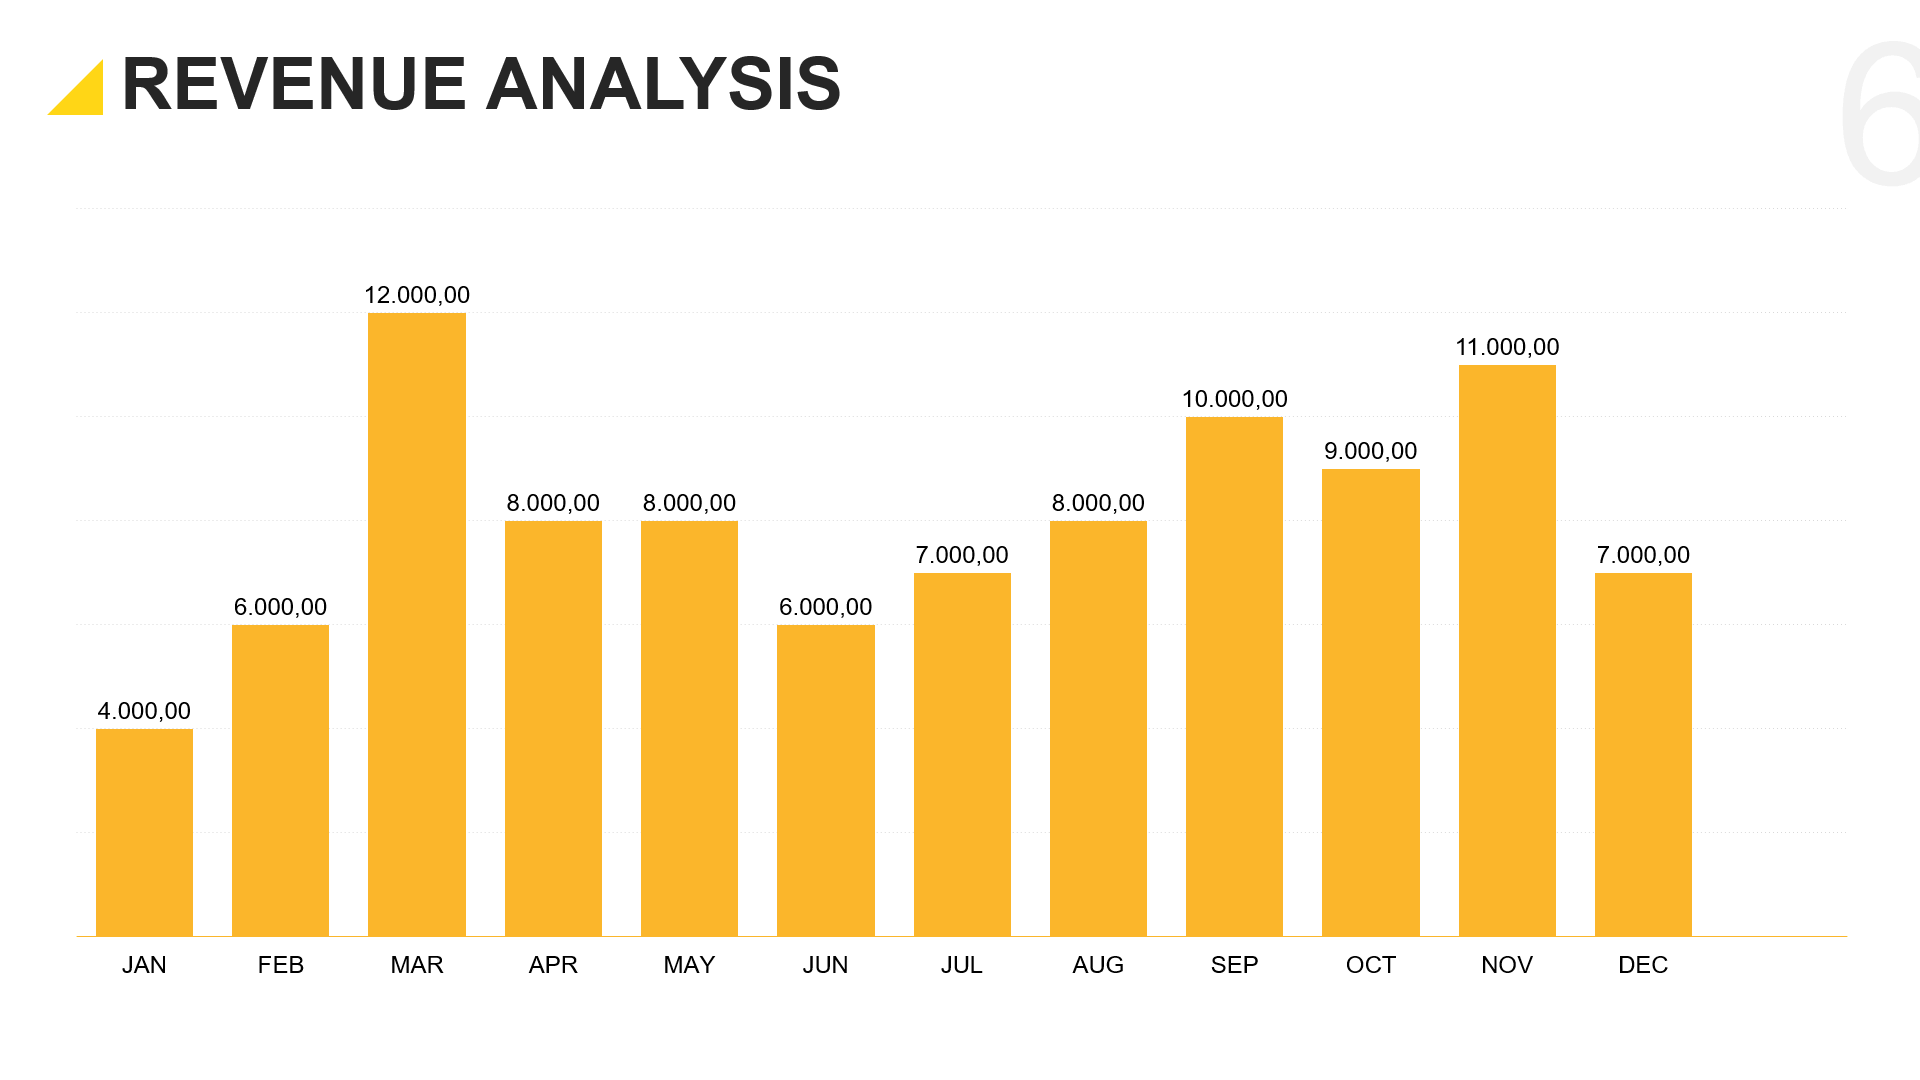
FinGraph Financial Chart Presentation was created especially for analysts, managers and finance directors who want to give a more professional face to their presentation of financial results.
Graphical representations of finance are great ways to see what’s going on in your business. Reviewing indicators in team meetings is a fundamental practice of professional companies that want to keep their finances healthy and grow.
With a total of 17 ready-made slides containing different graphics formats, the presentation is 100% editable, and can have its colors changed, images and graphics customized according to your preference.