Presentation of Financial Results in Powerpoint
Financial Results Presentation is a ready-made presentation template, it is a Powerpoint theme, with editable slides for you to make your financial presentation visually flawless and in few minutes.
It was developed based on theories and spreadsheets focused on financial results presentations. By downloading this Powerpoint, you will have more than 60 slides totally focused on the business finance environment, being able to make your results presentation in just a few minutes, with great appeal and visual impact.
The Presentation of Financial Results can be used both by consultants who want to present the results of their consultancy, as well as by managers or employees who want to show the results of their area to directors, direct superiors or the rest of the company.
This presentation can be used at various times, such as: monthly, semi-annual and annual results statement, when proposing cuts or new investments in the company and even when presenting a new financial plan or budget control for the company’s new year.
Slides contain image spaces (called placeholders) where you can simply drag your image onto the slide and you’re done. Your image will automatically fit the shape, be it rectangular, round, etc.
All elements are 100% editable and that includes tables, colors, texts and everything else. Making any changes is very simple.
This Financial Results Presentation contains the following slides:
– Cover slide
– Transition slides
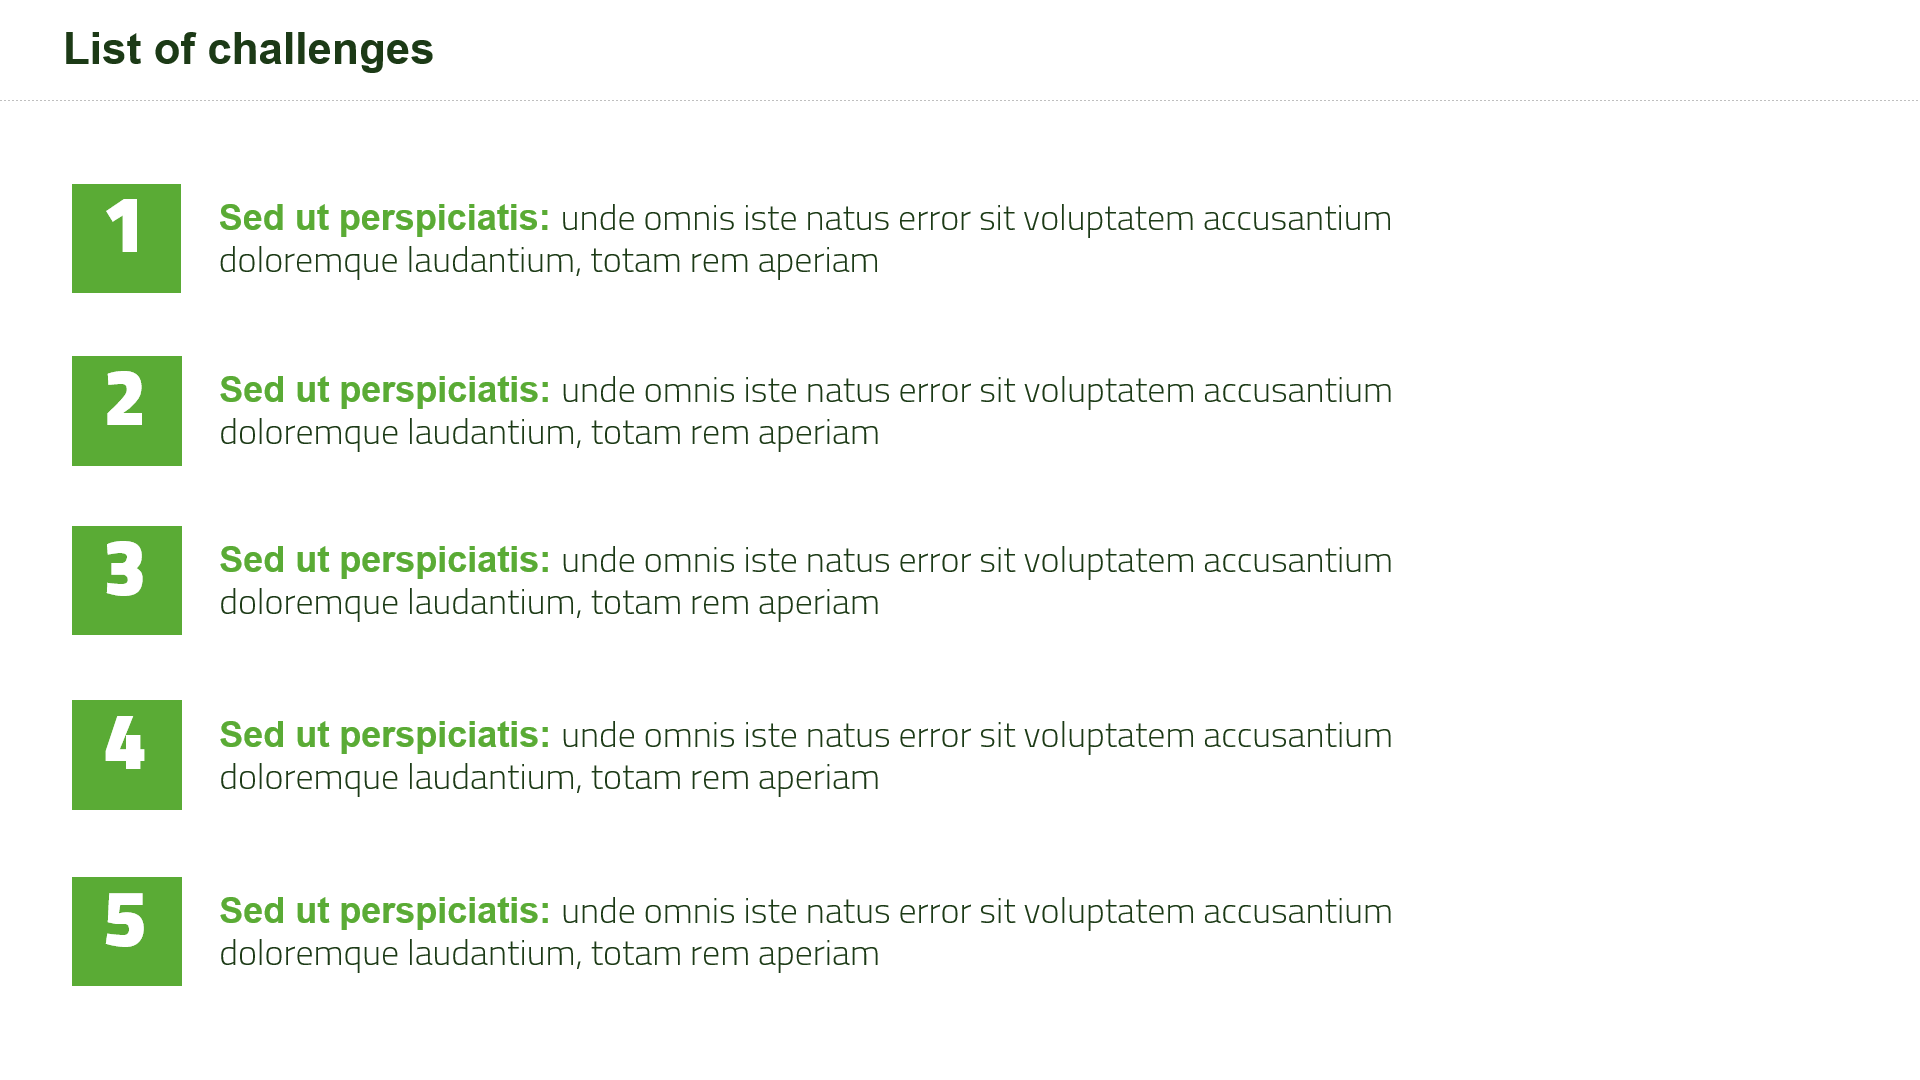
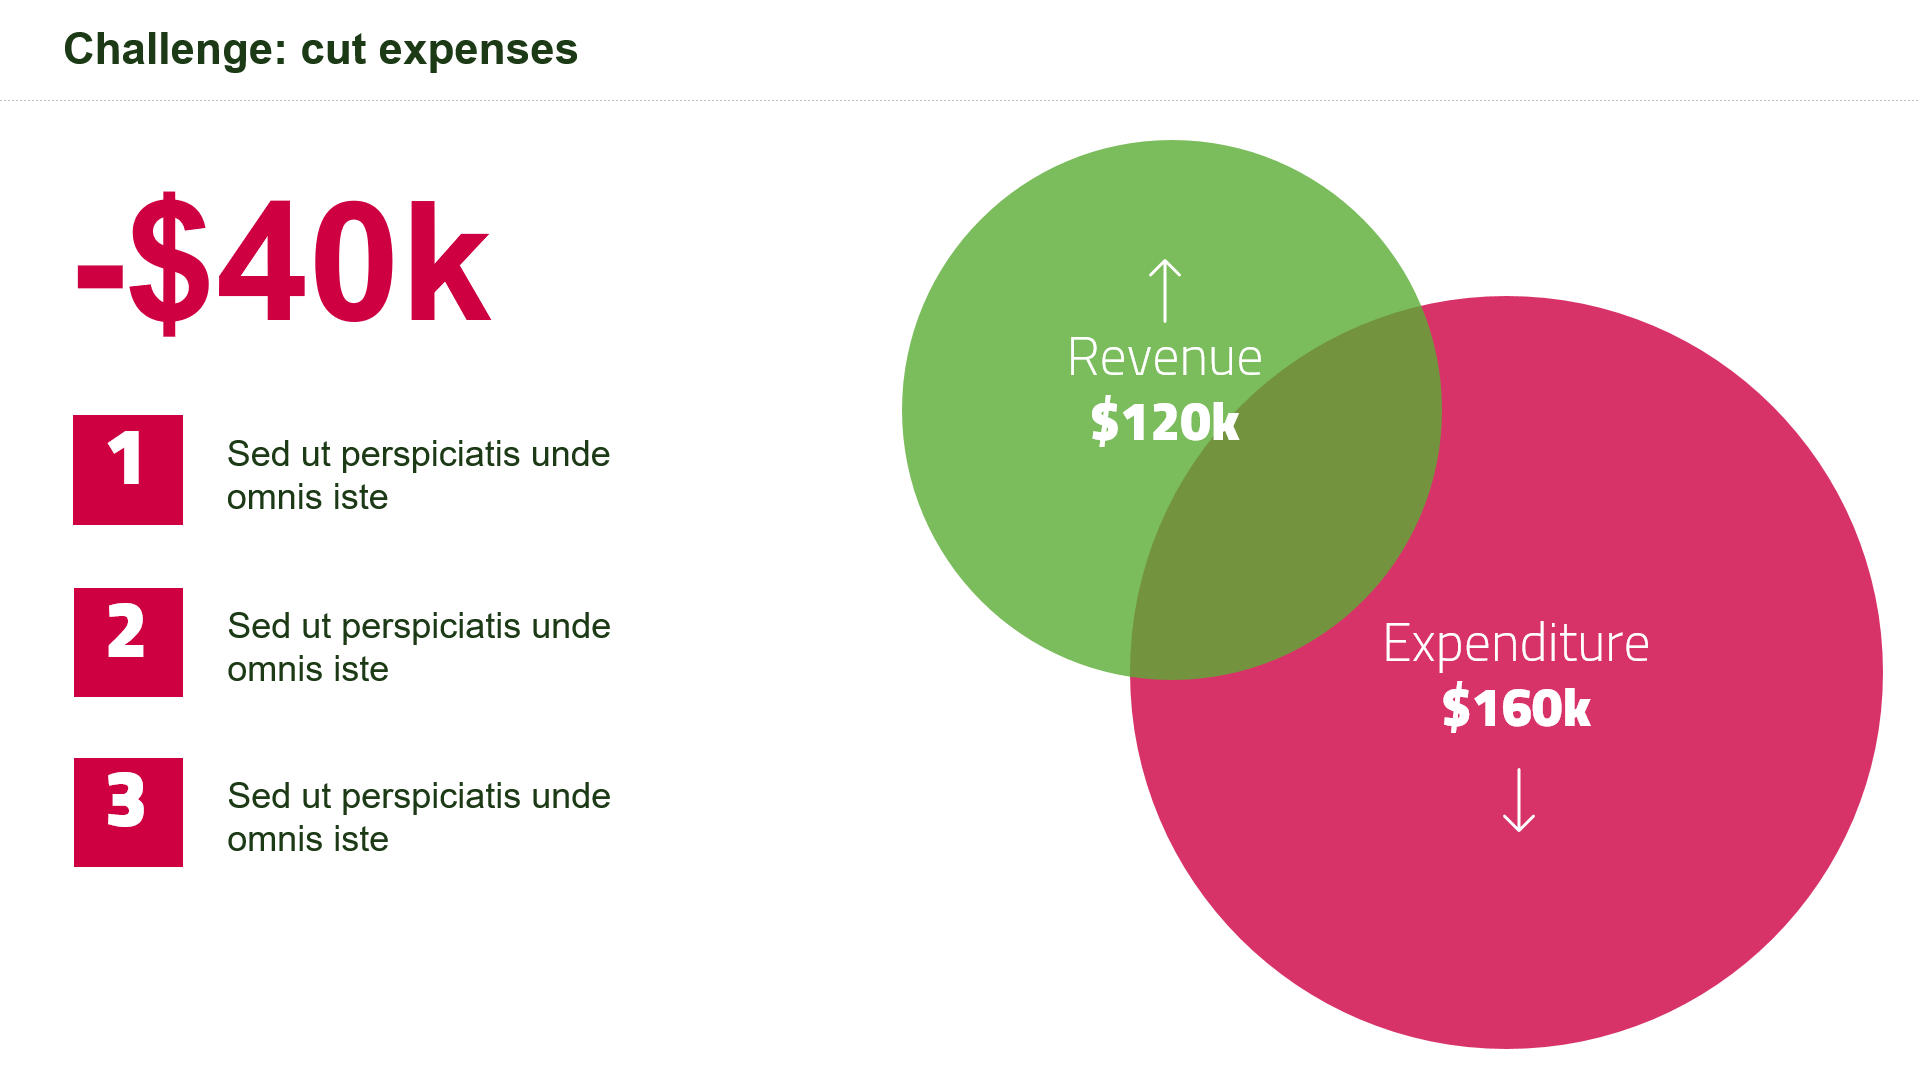
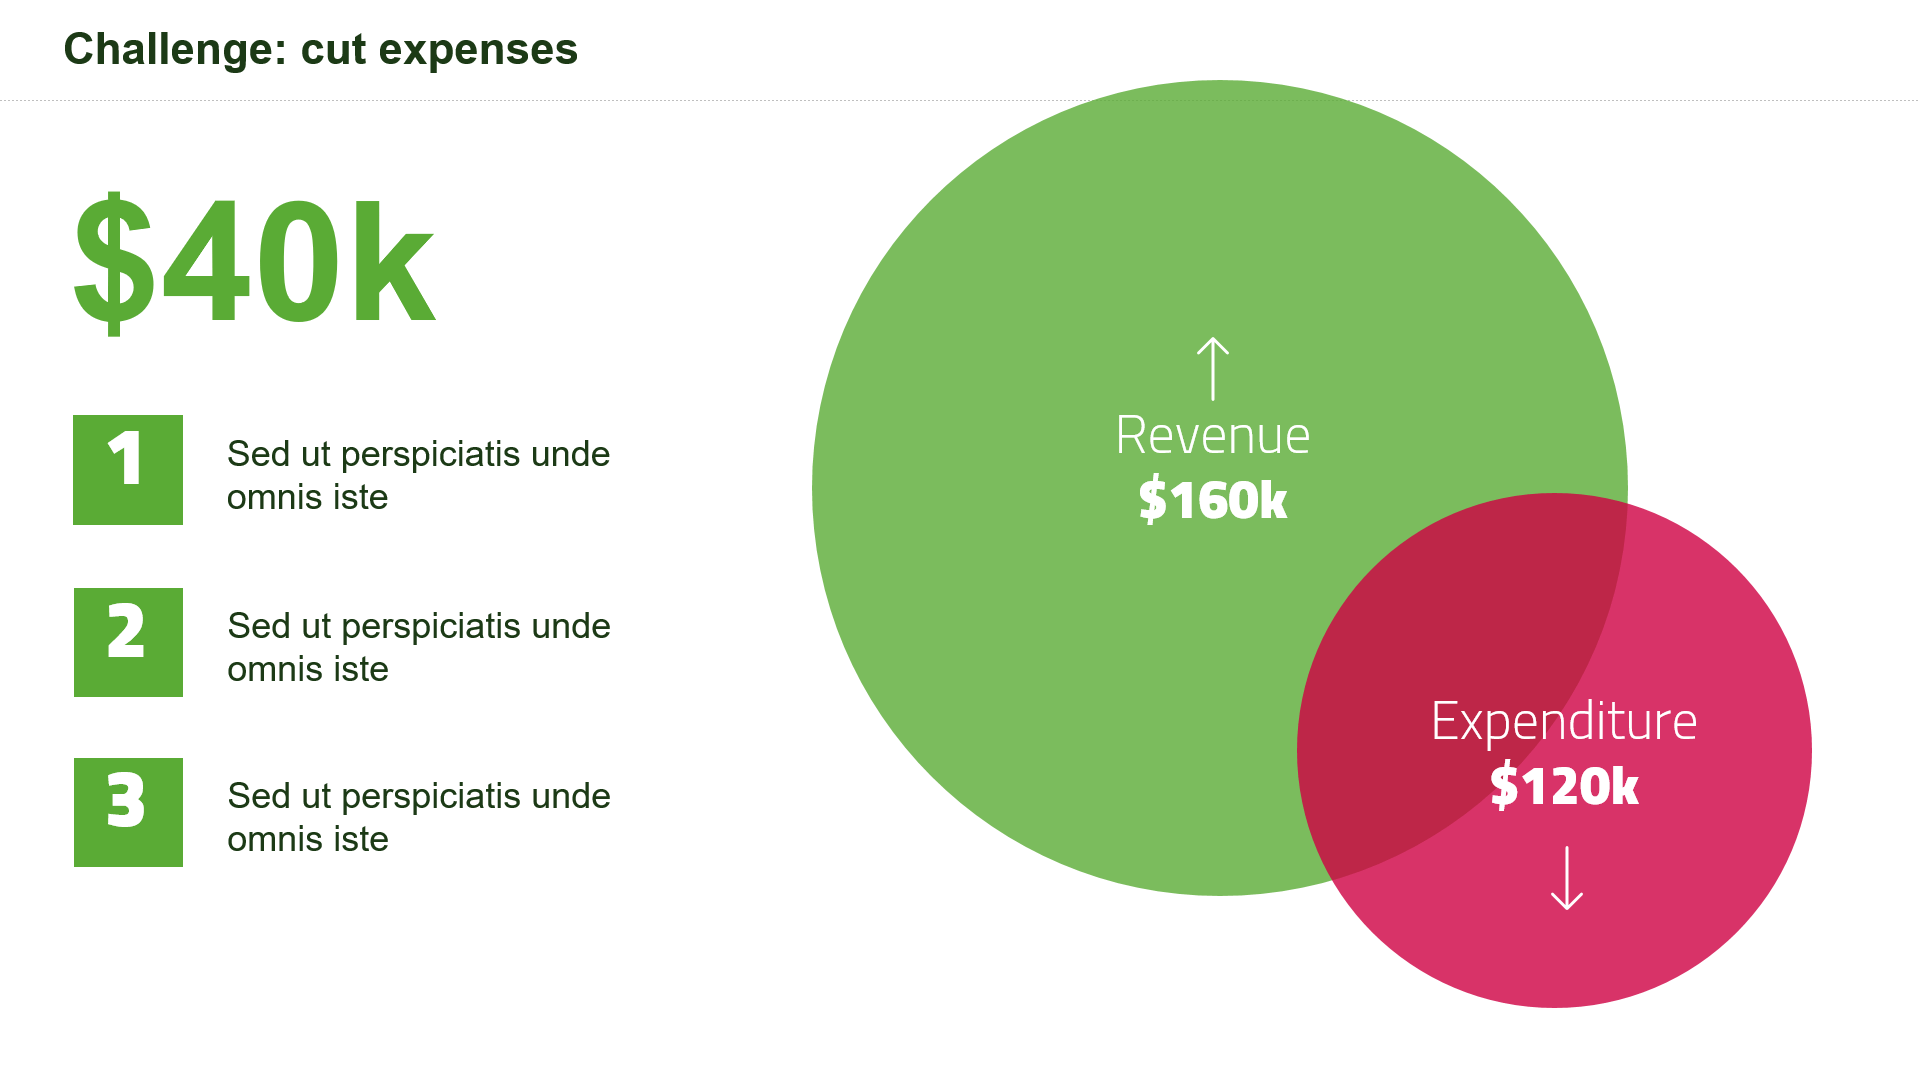
– About the challenge
– The finance team
– 2 column text
– 2 column text + image
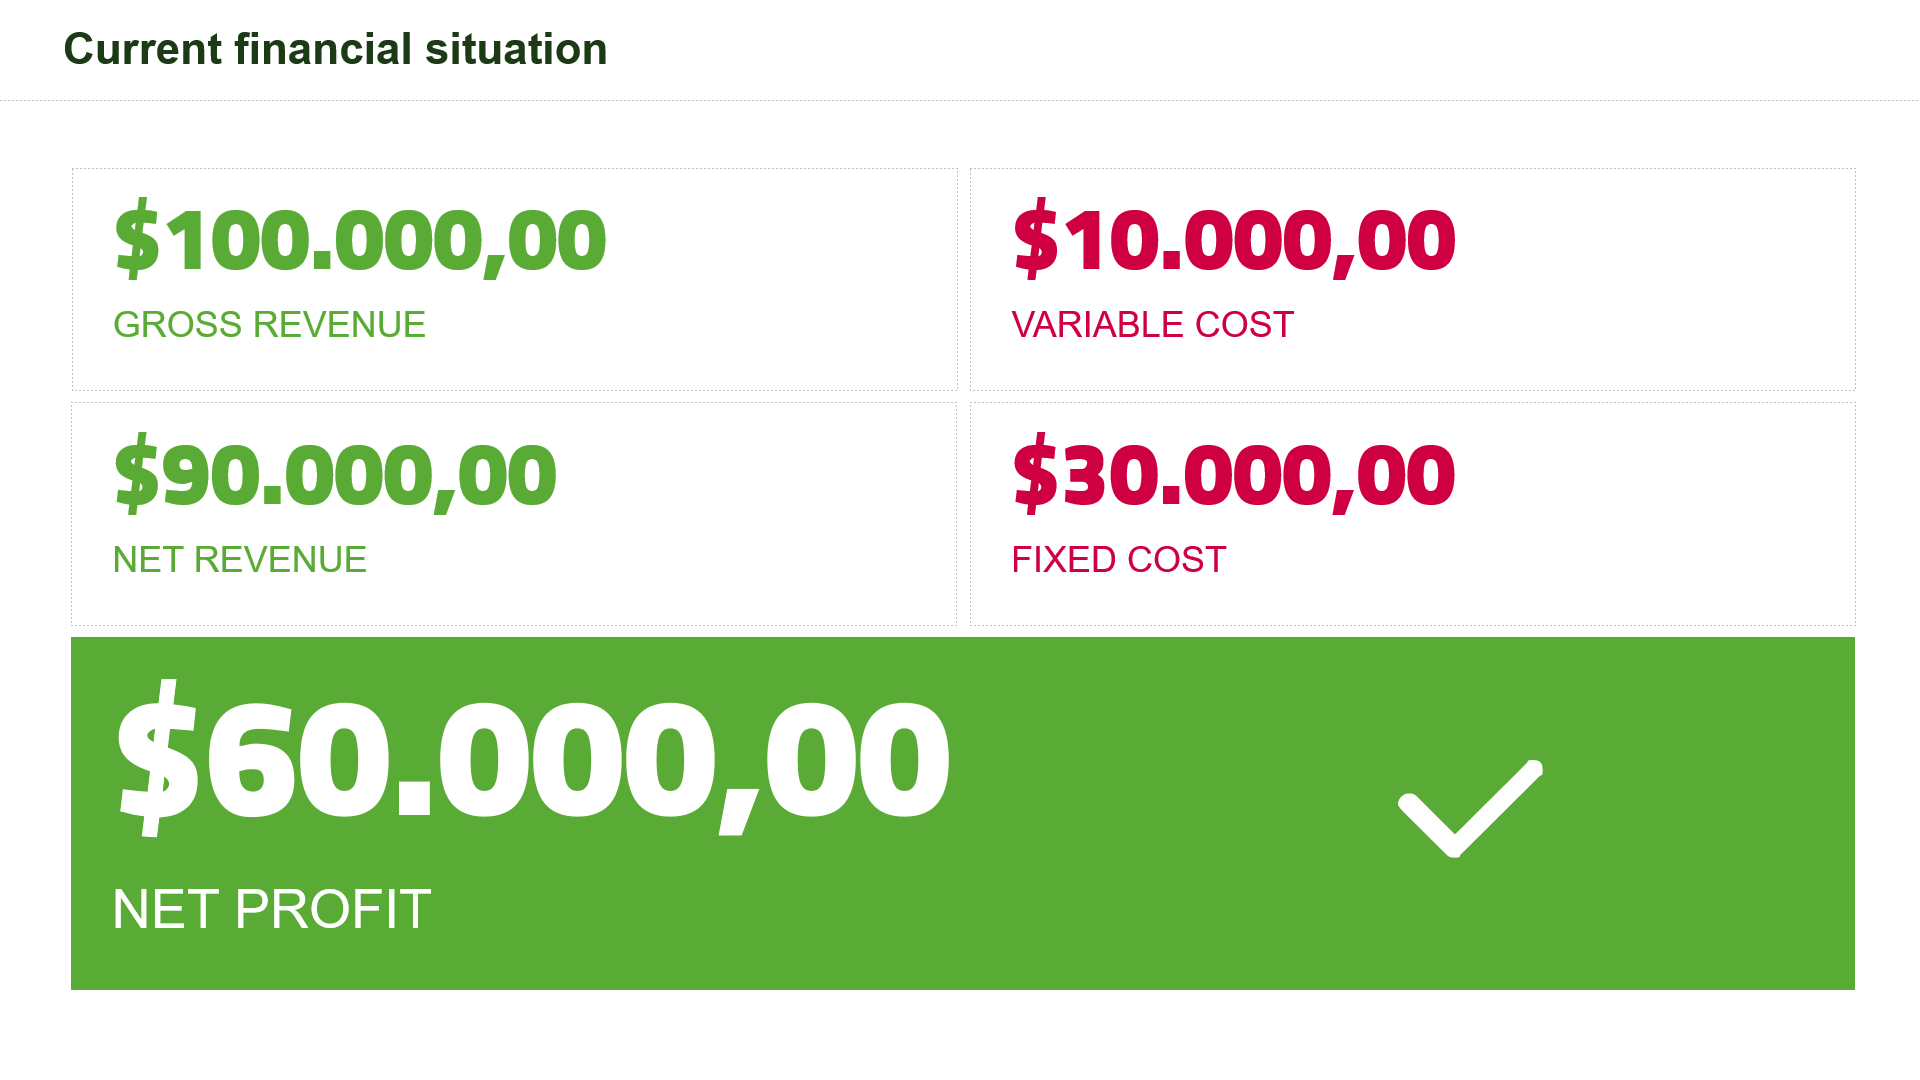
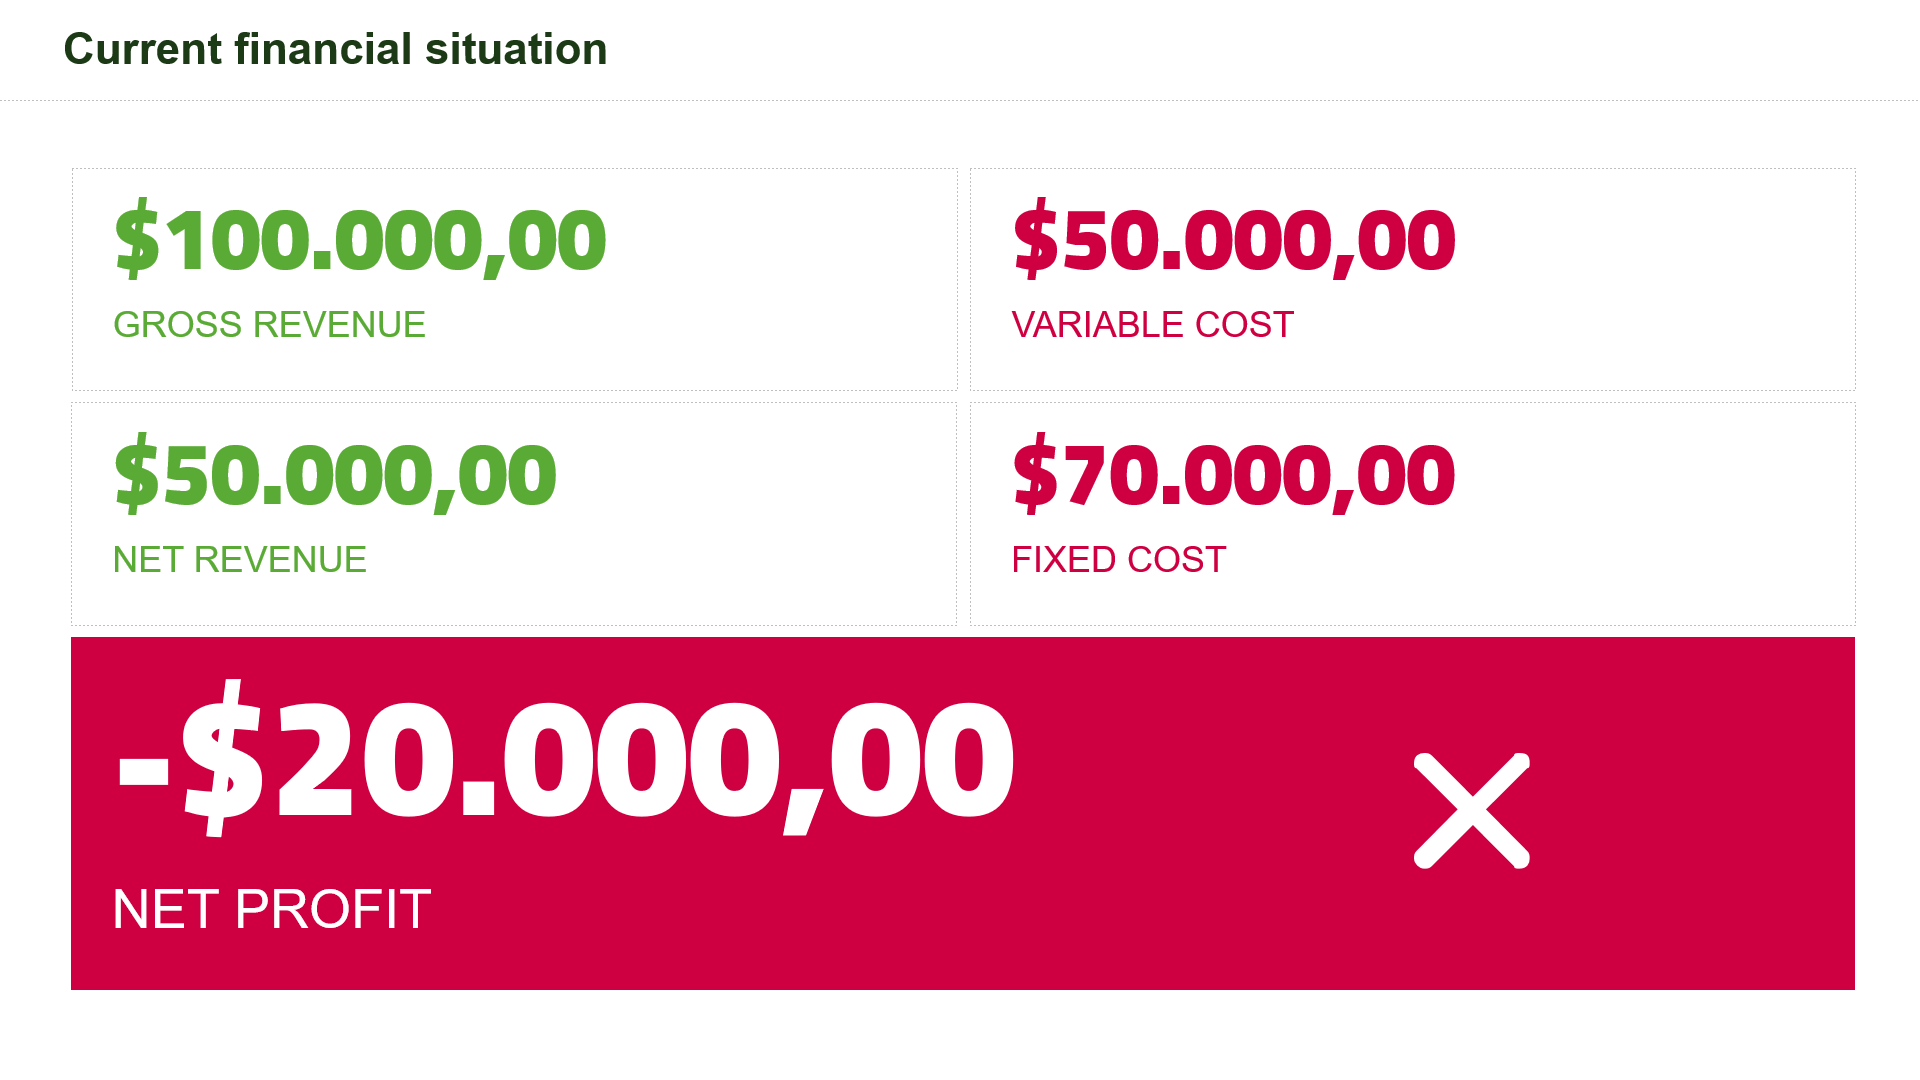
– Current situation
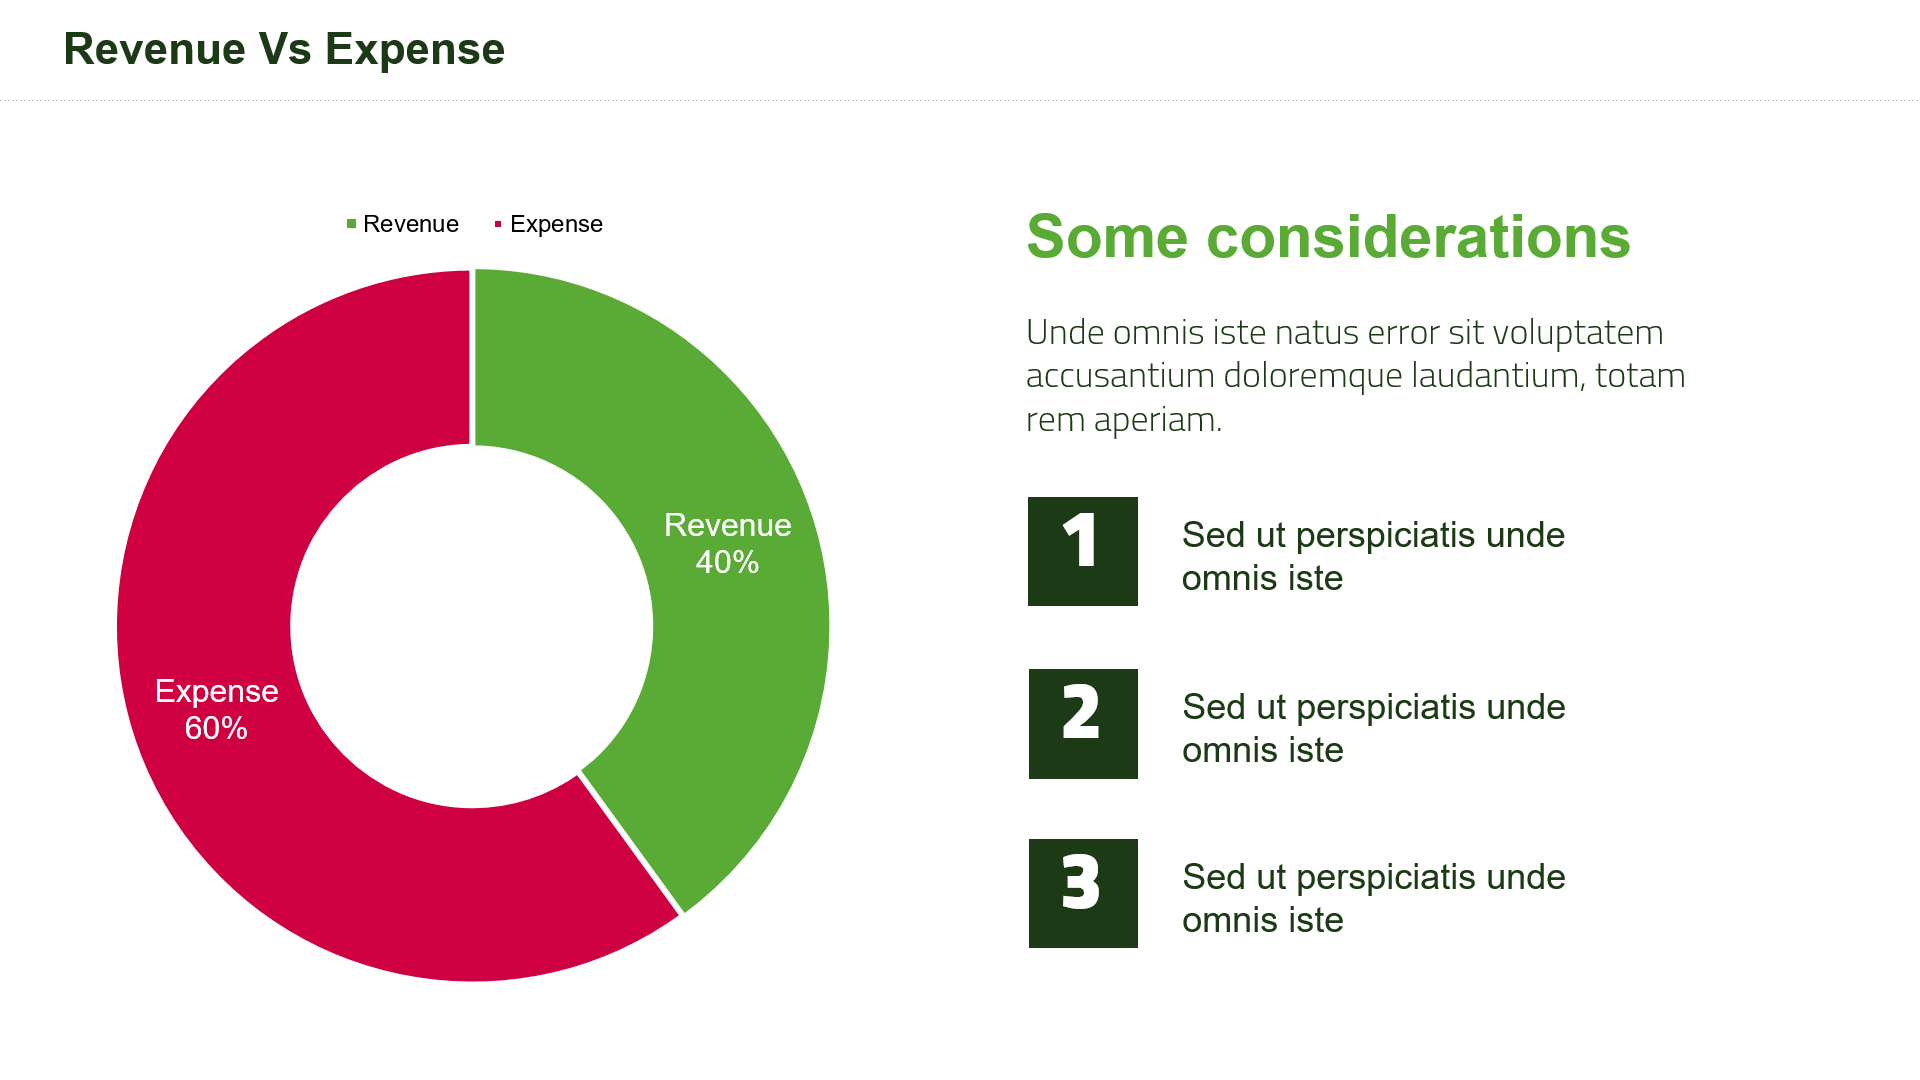
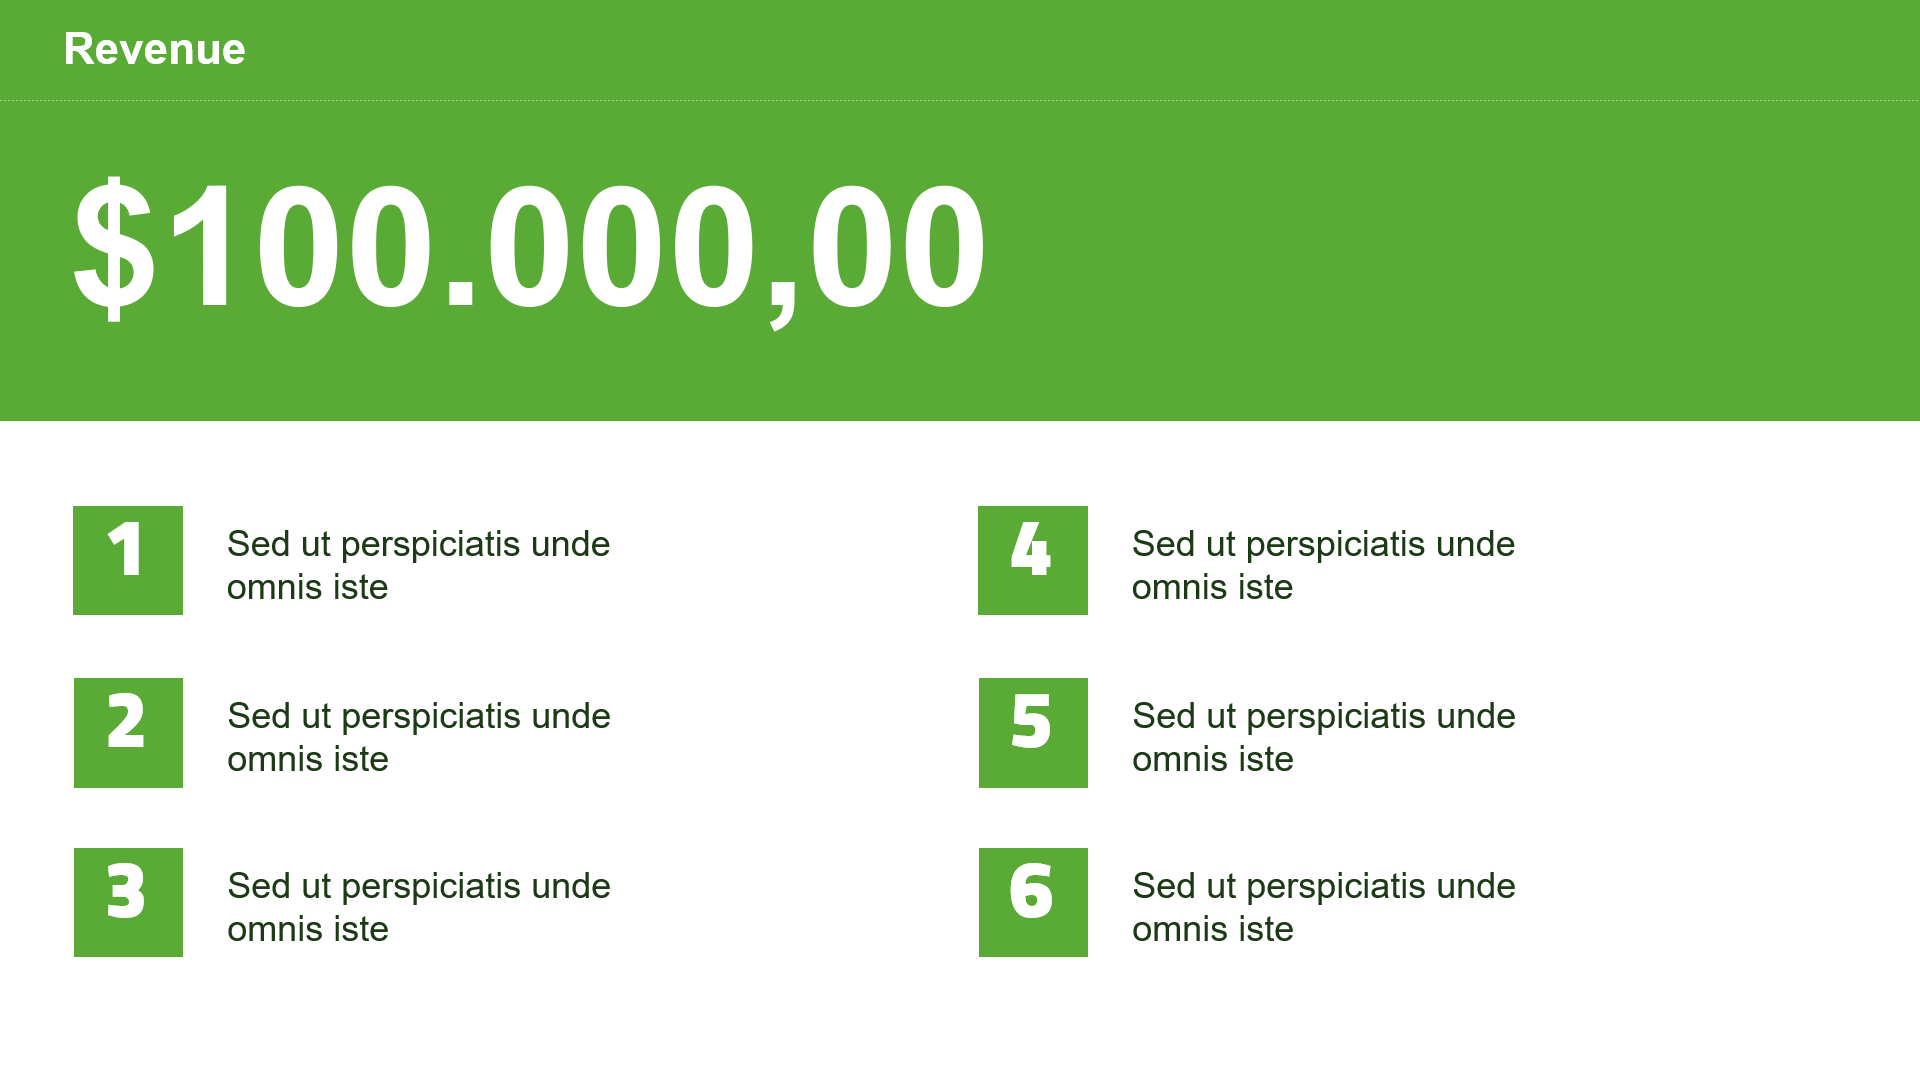
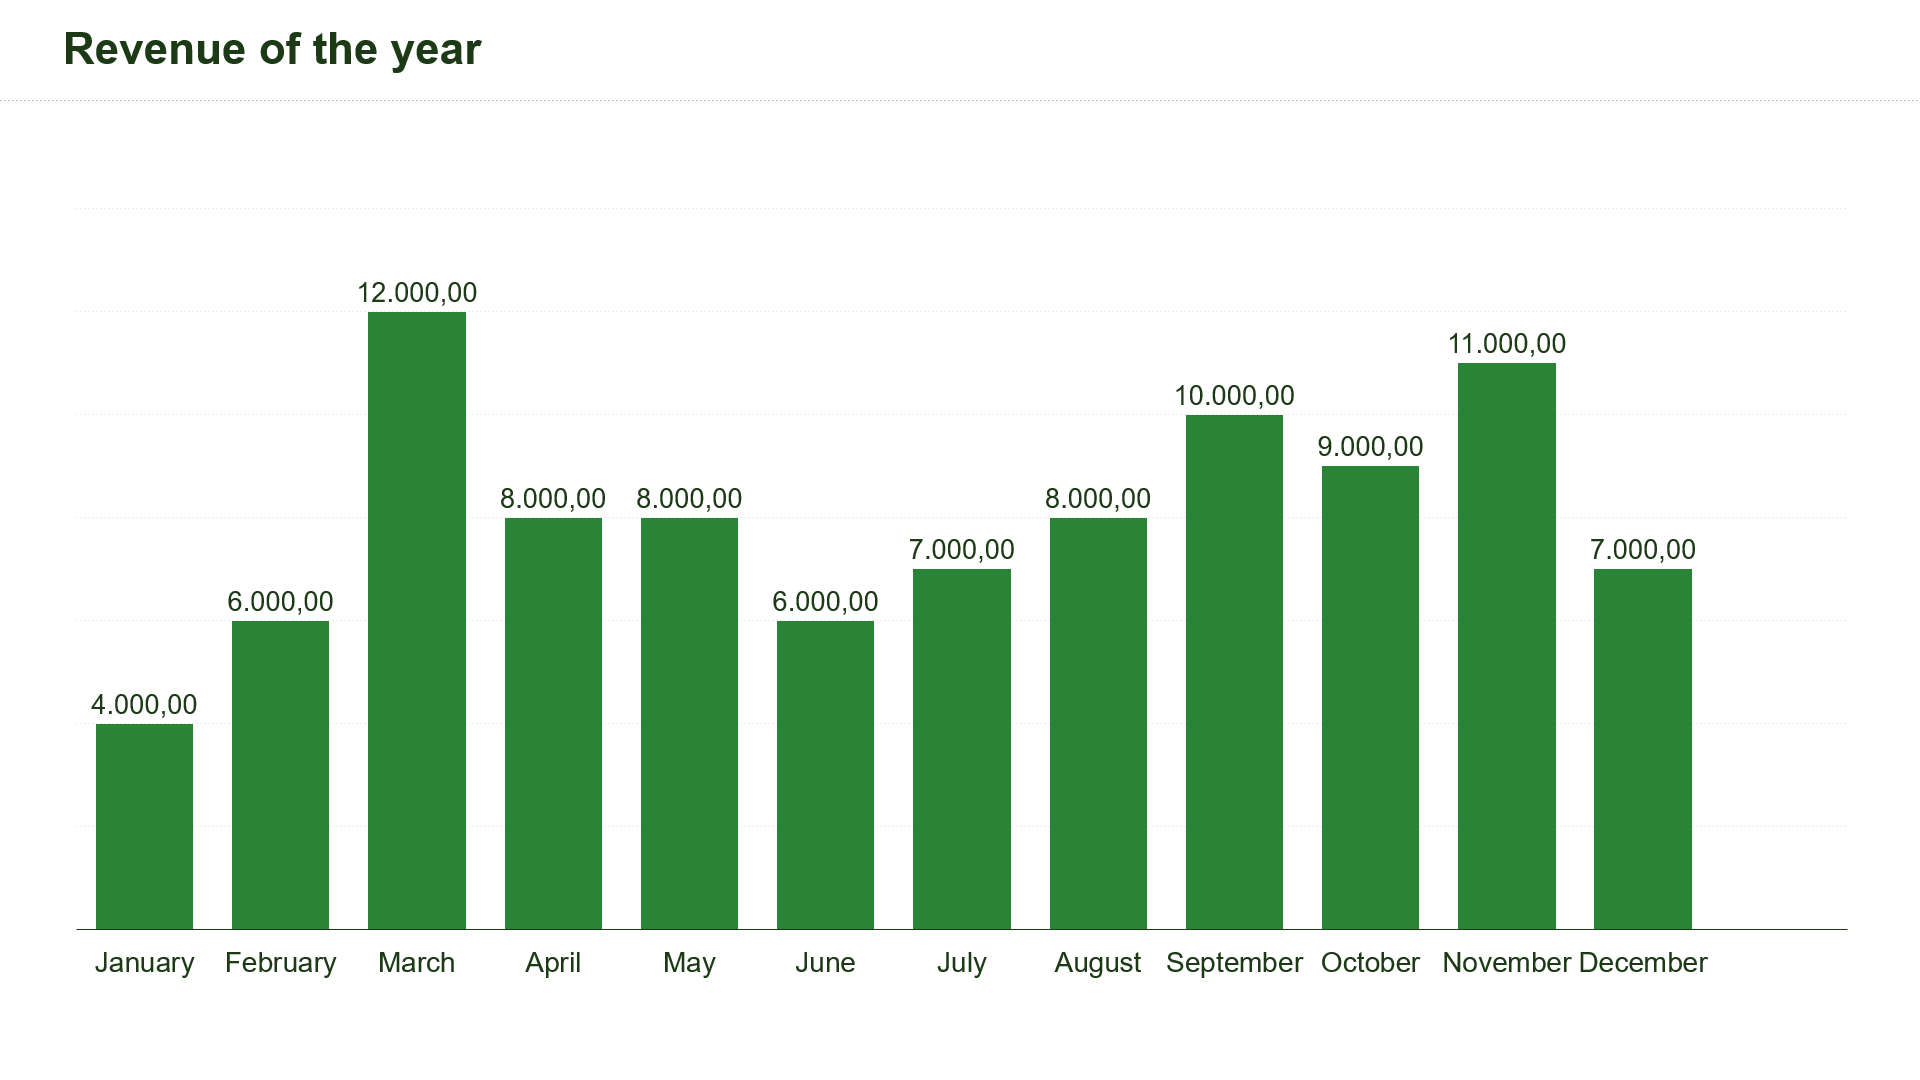
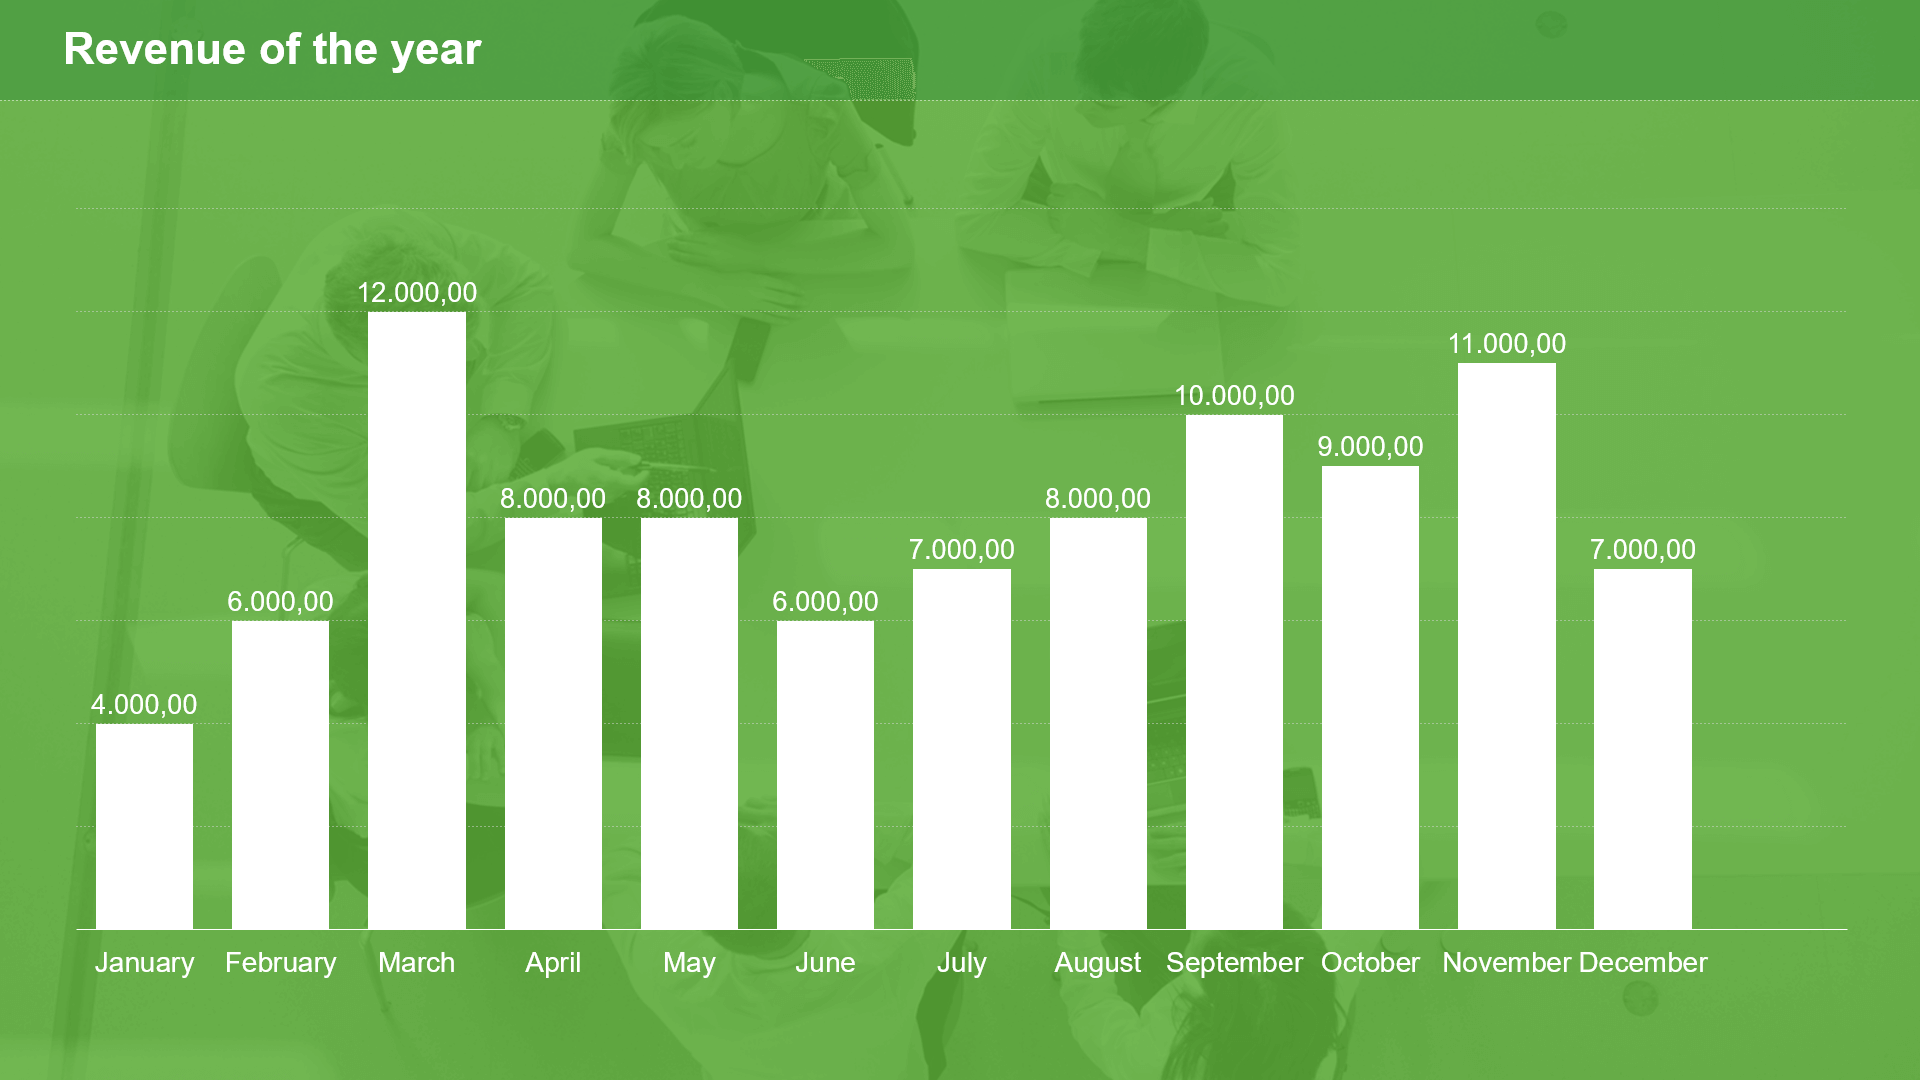
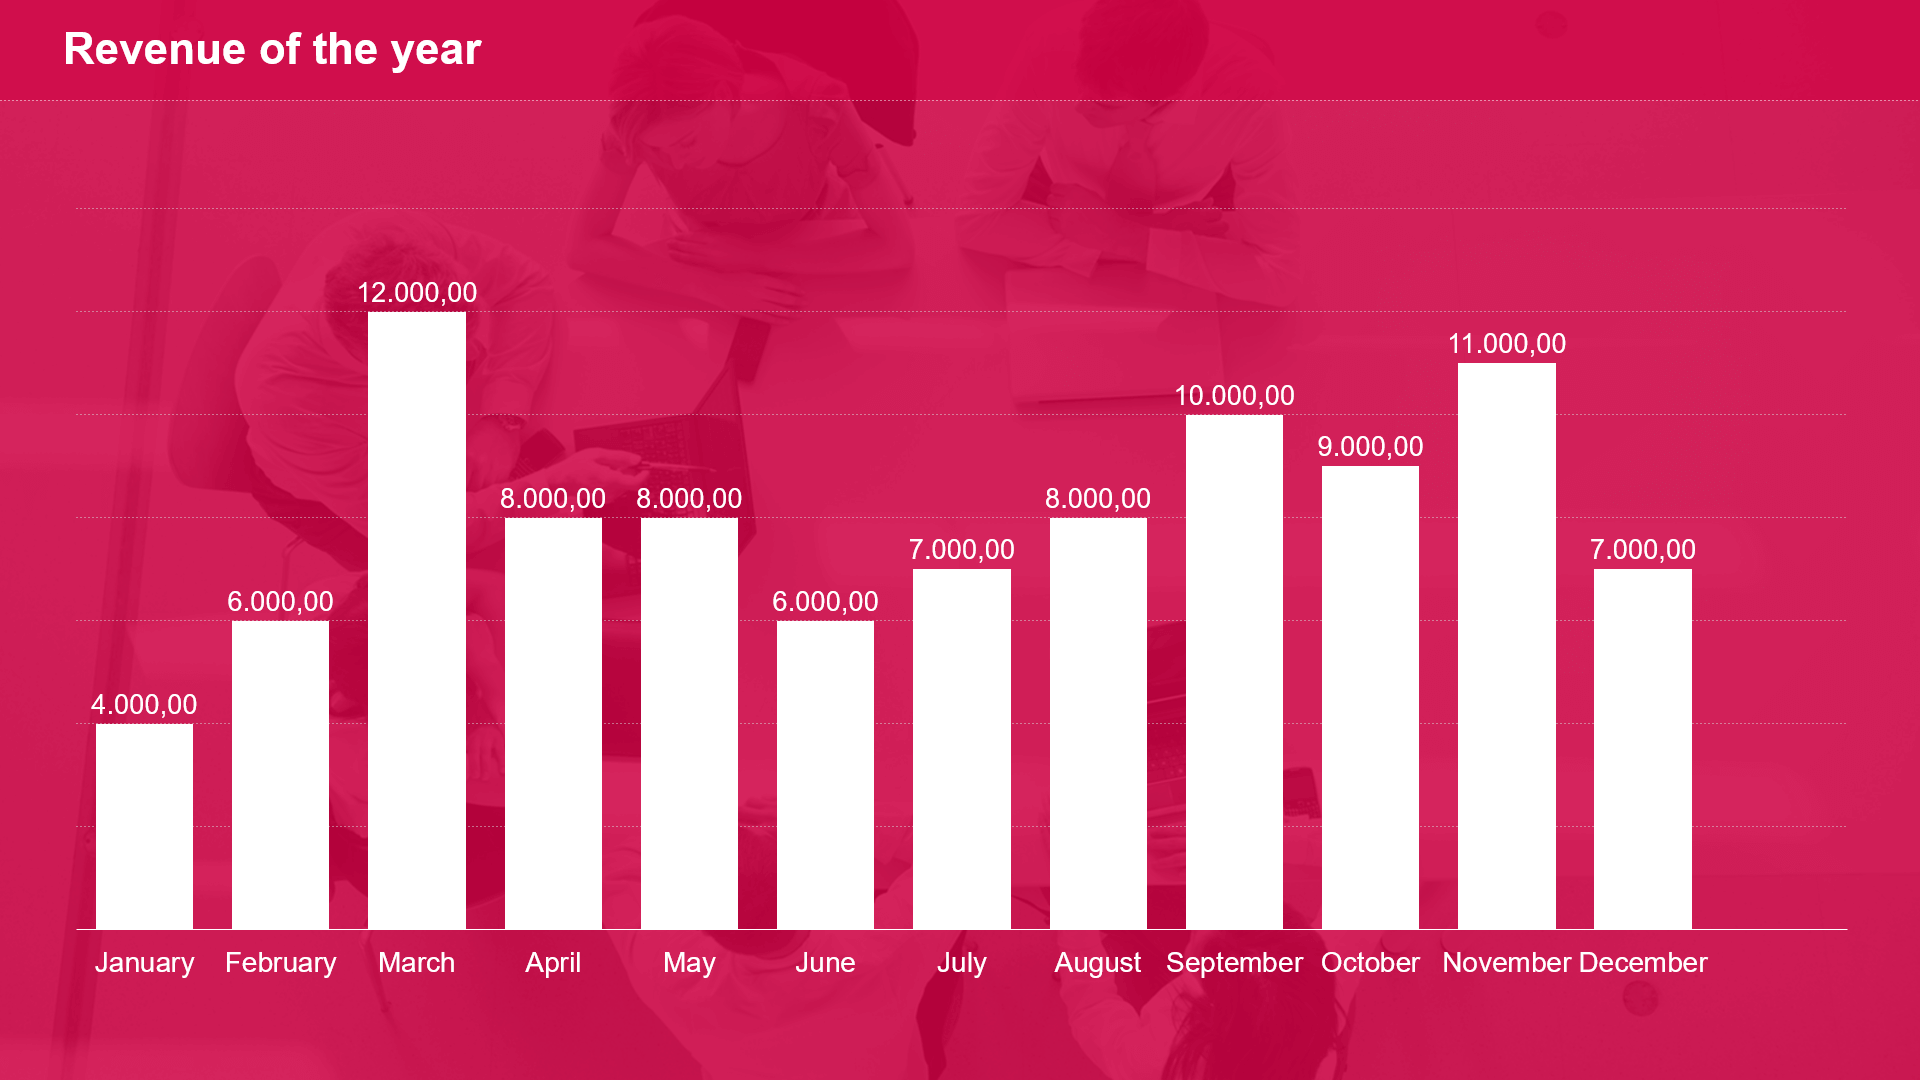
– General receipts
– General expenses
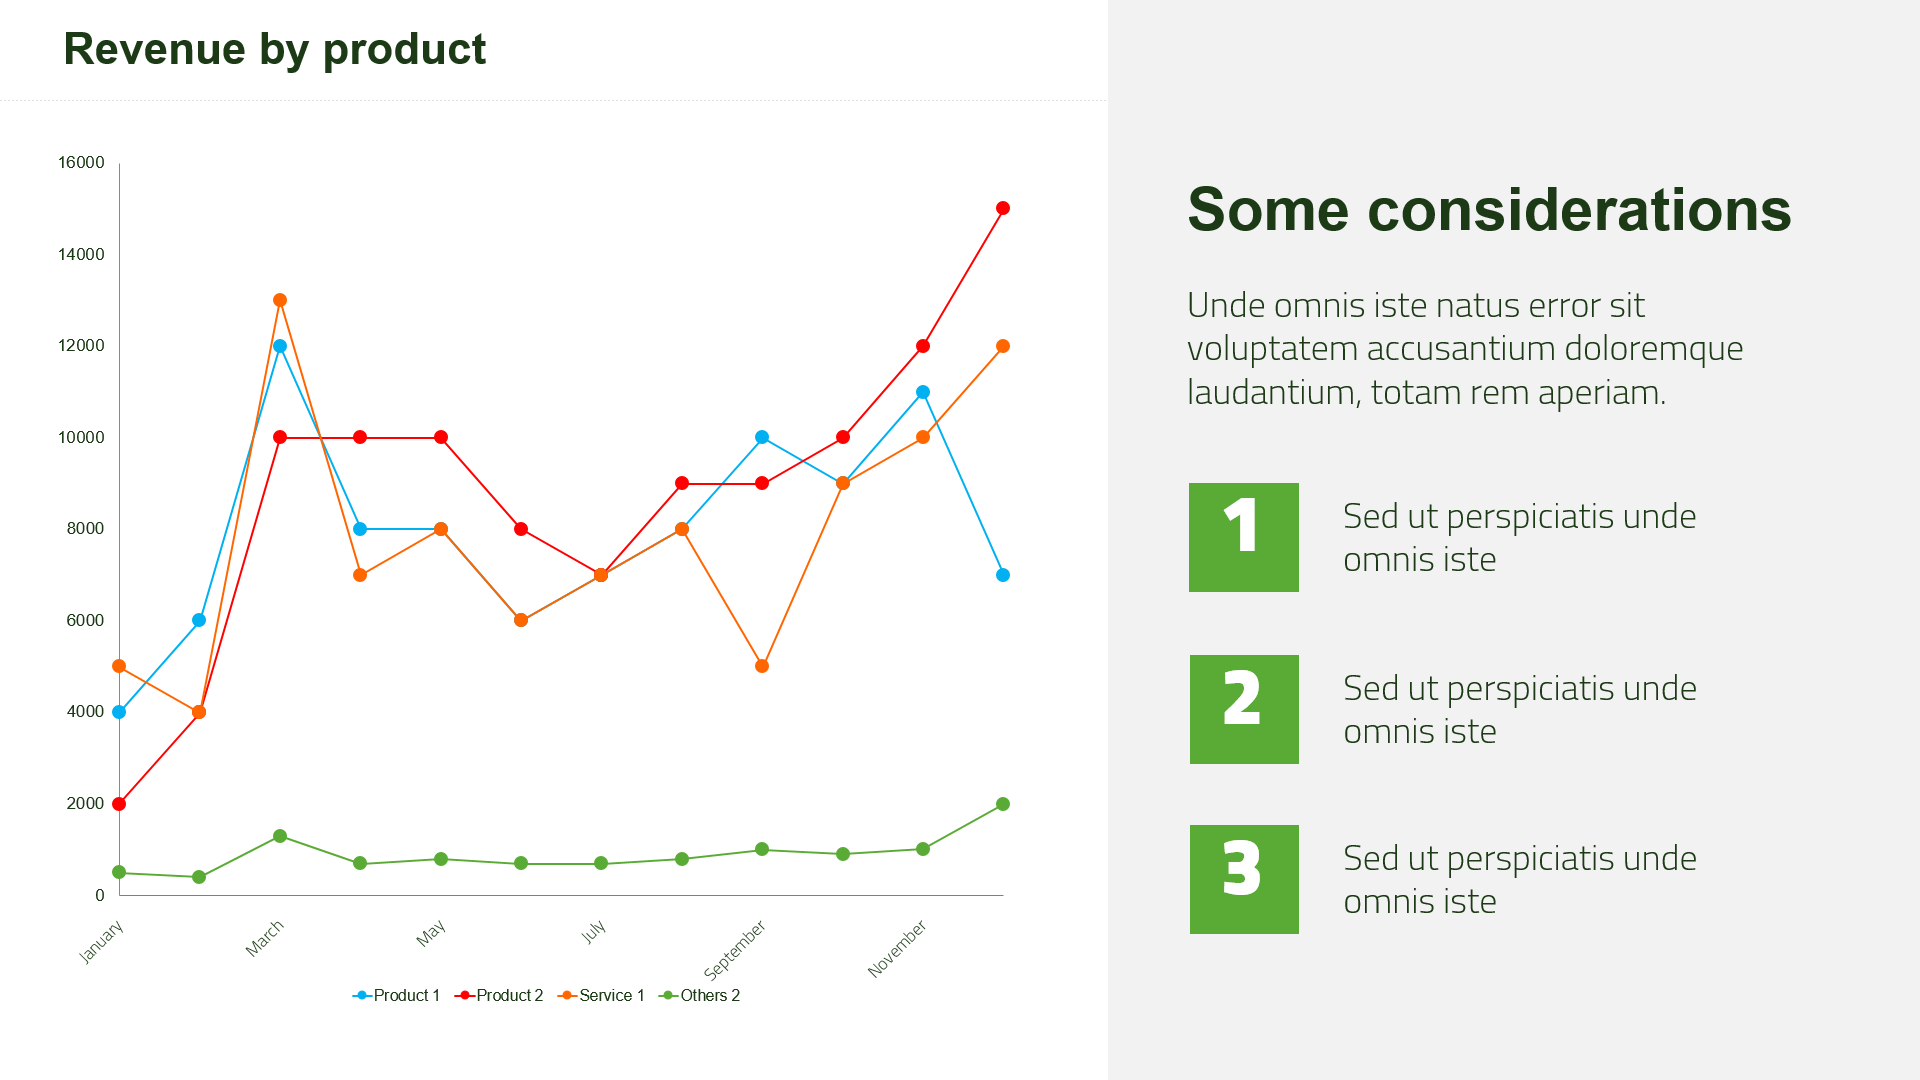
– Revenues by Product
– Costs per product
– Expenses by area
– Chart of Accounts
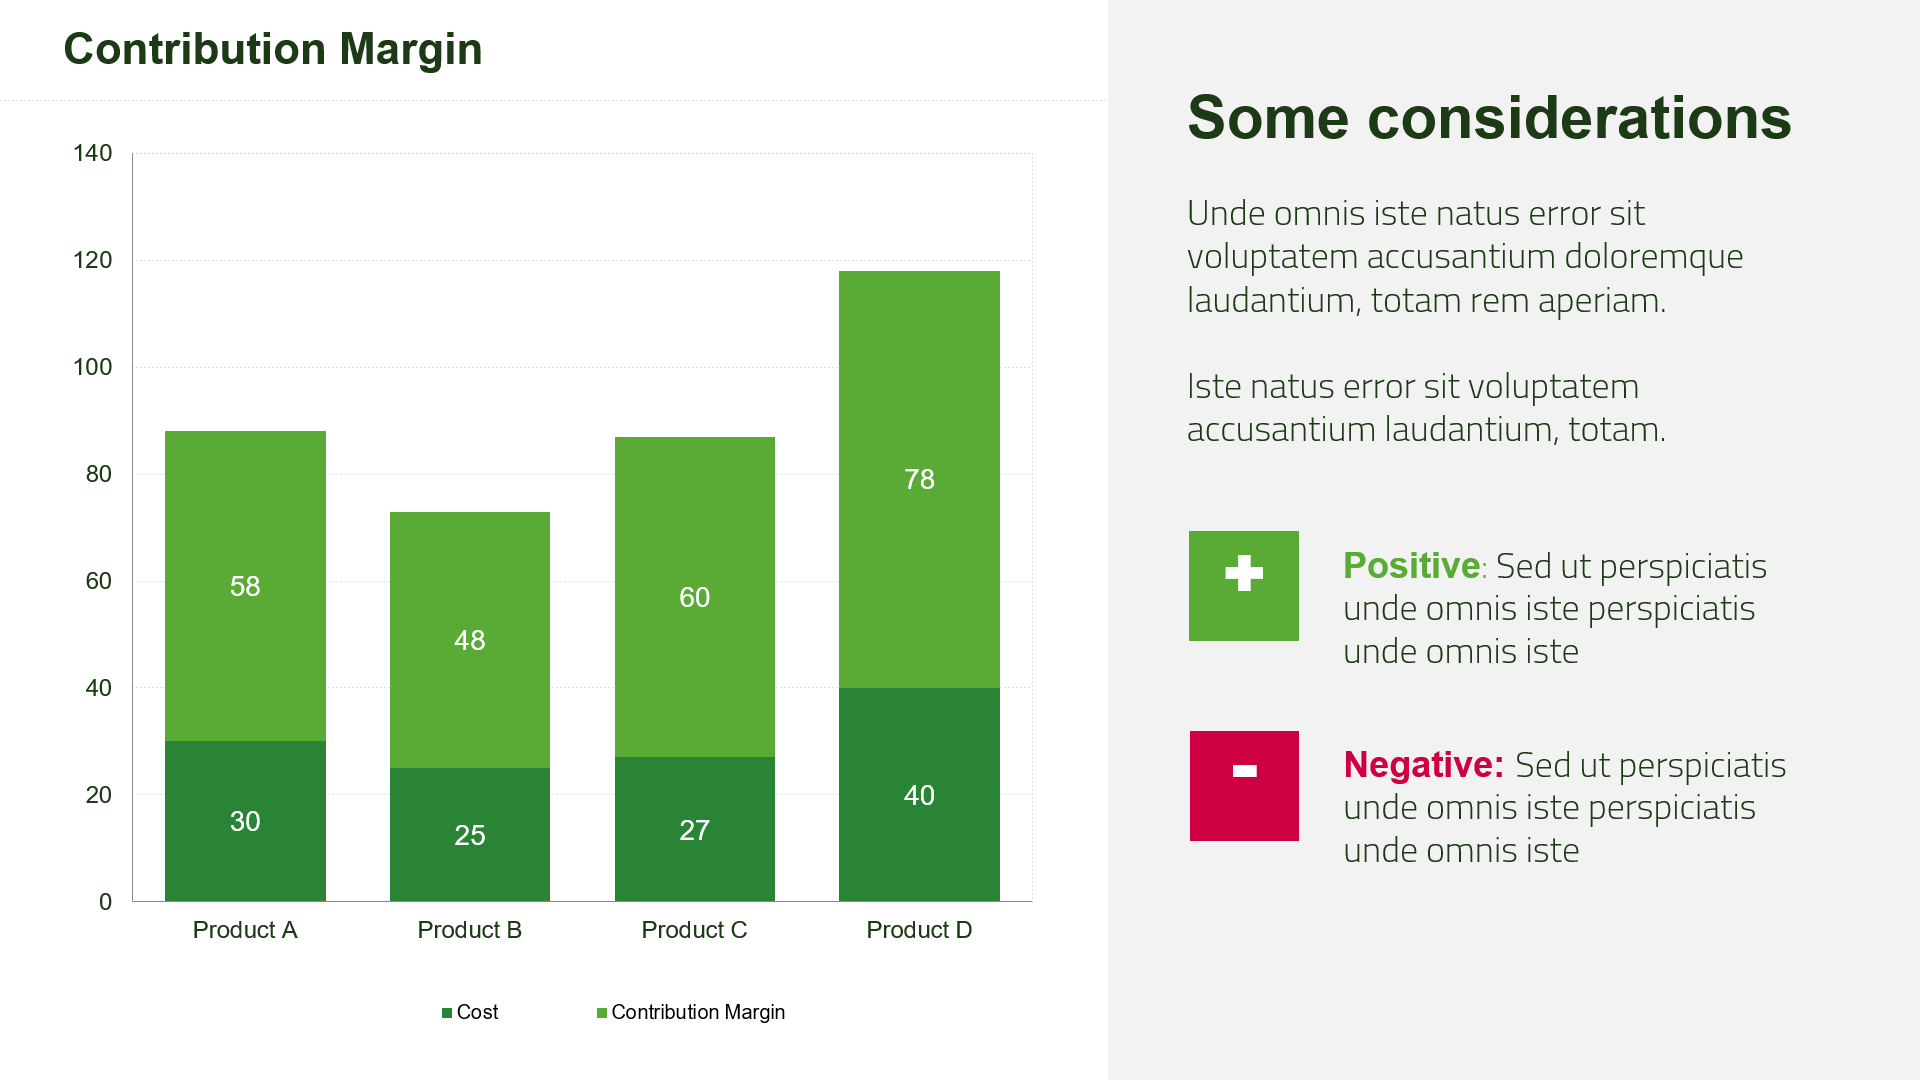
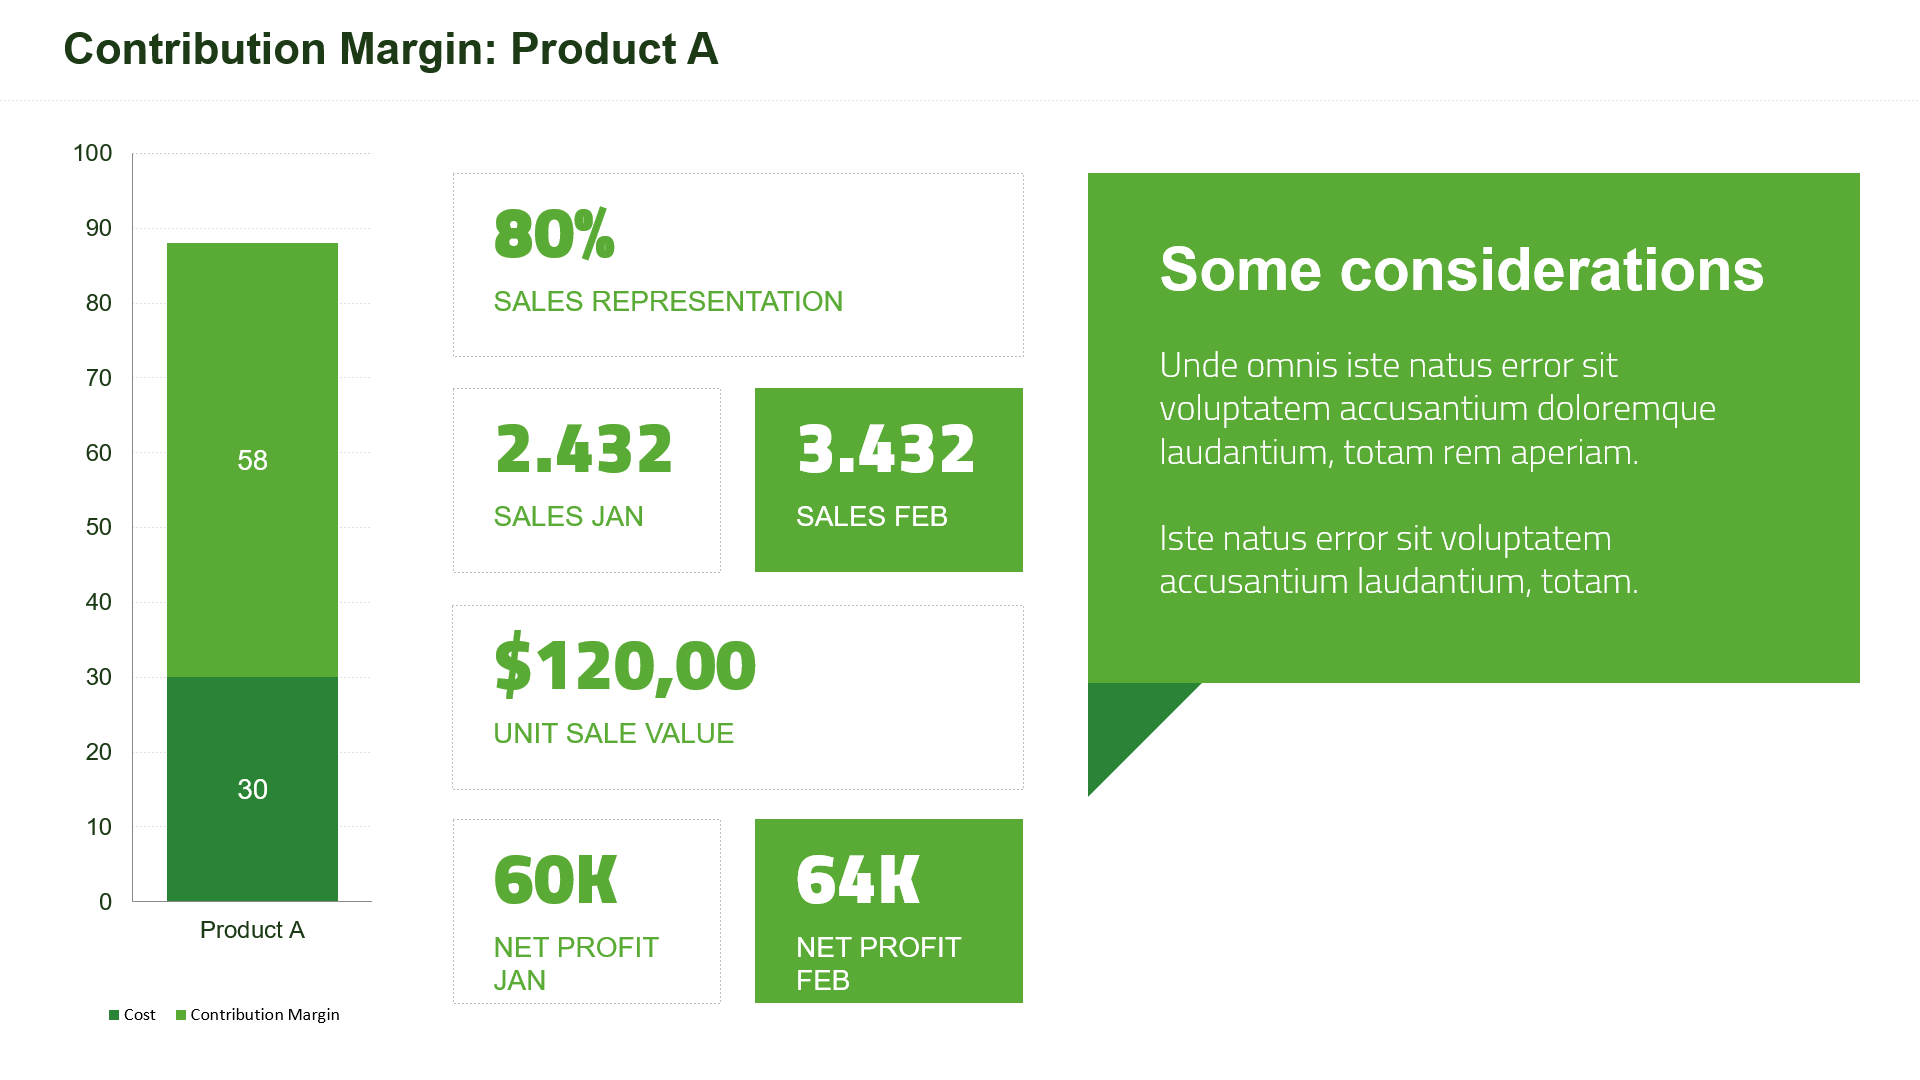
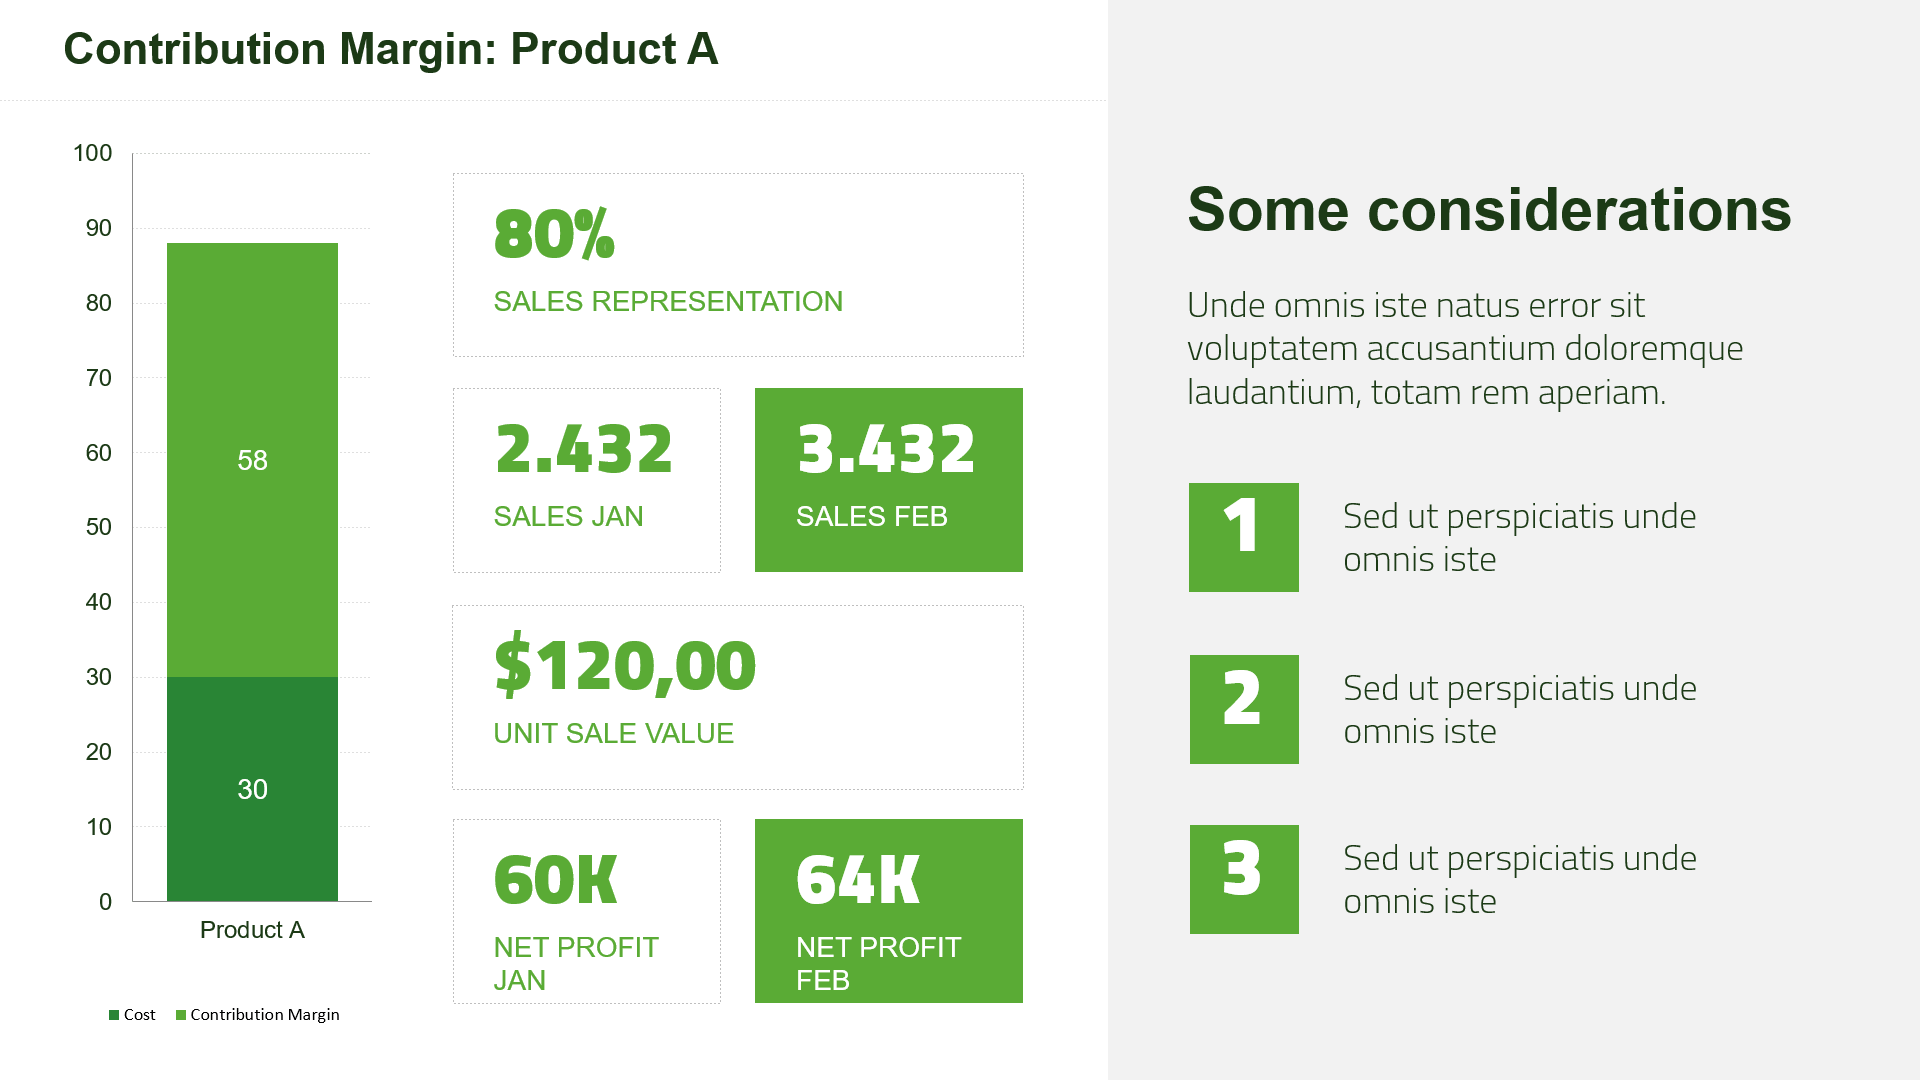
– Contribution margin
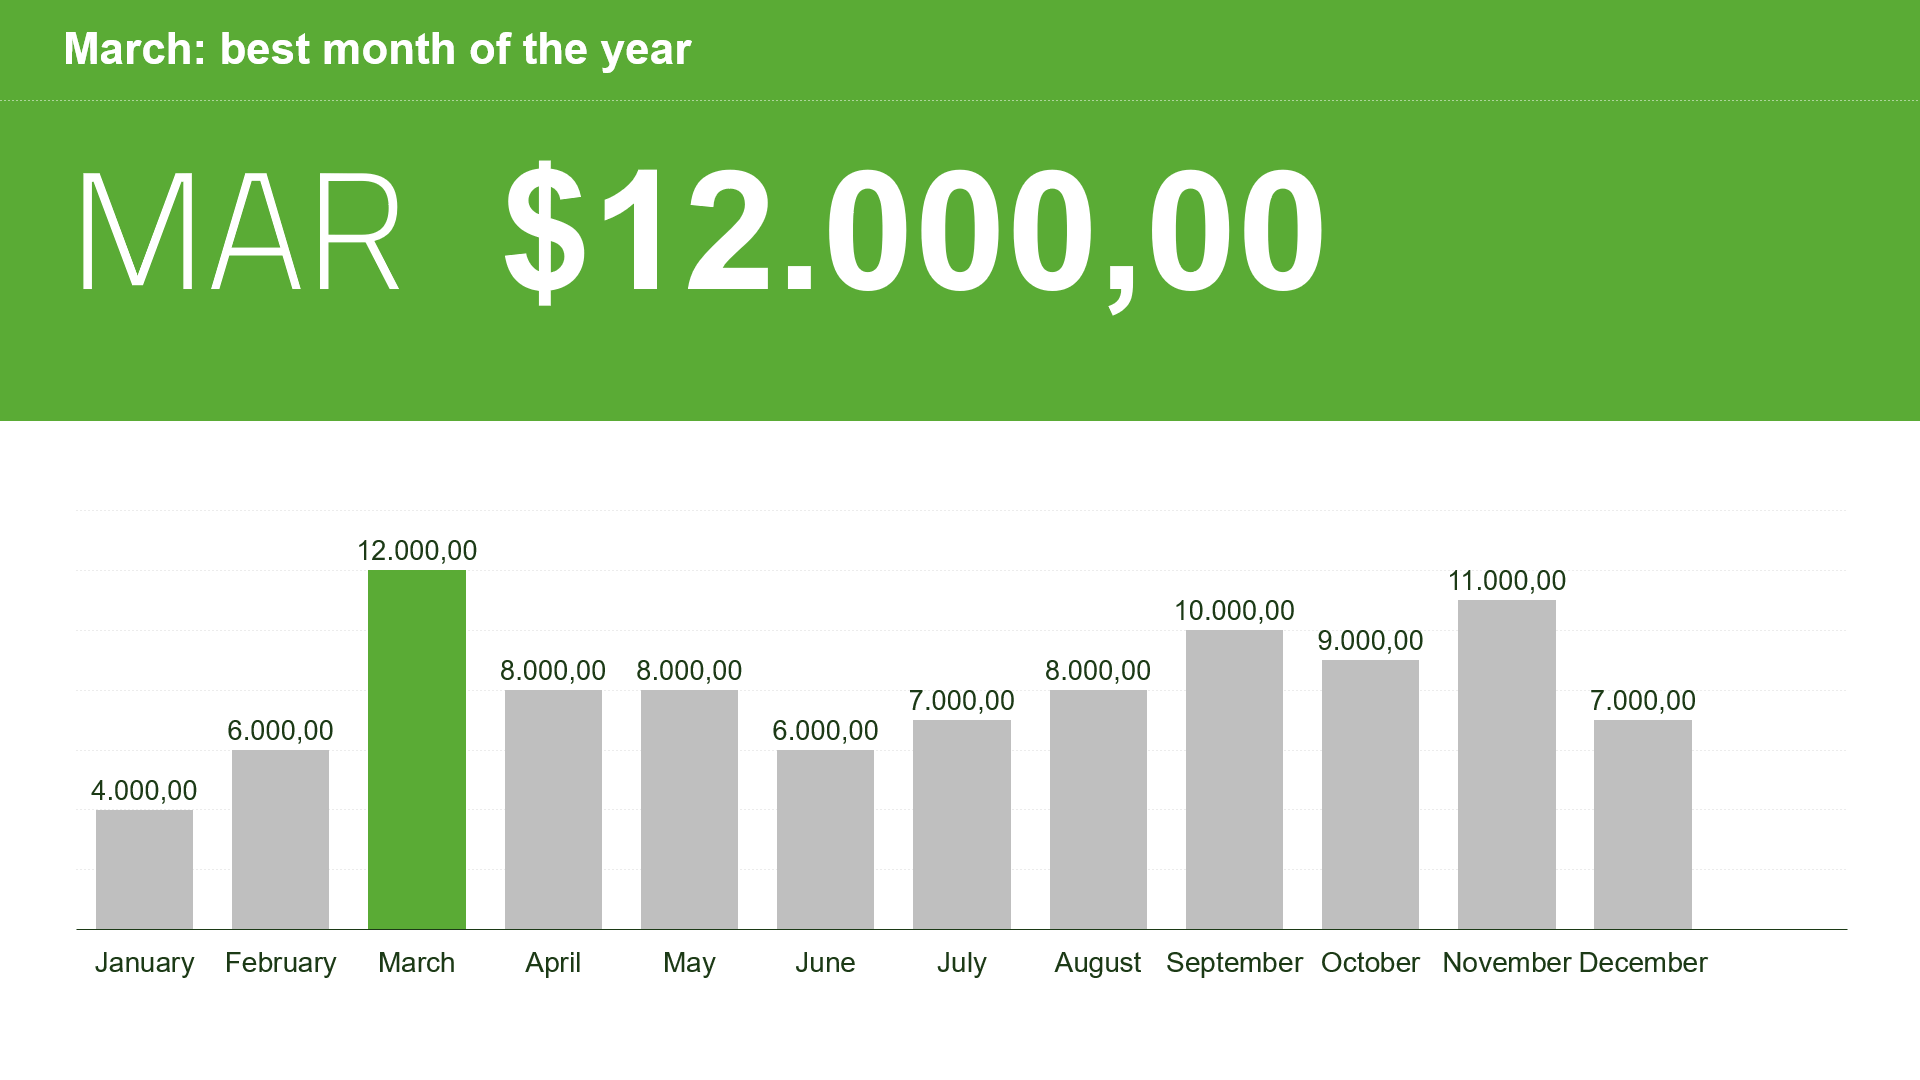
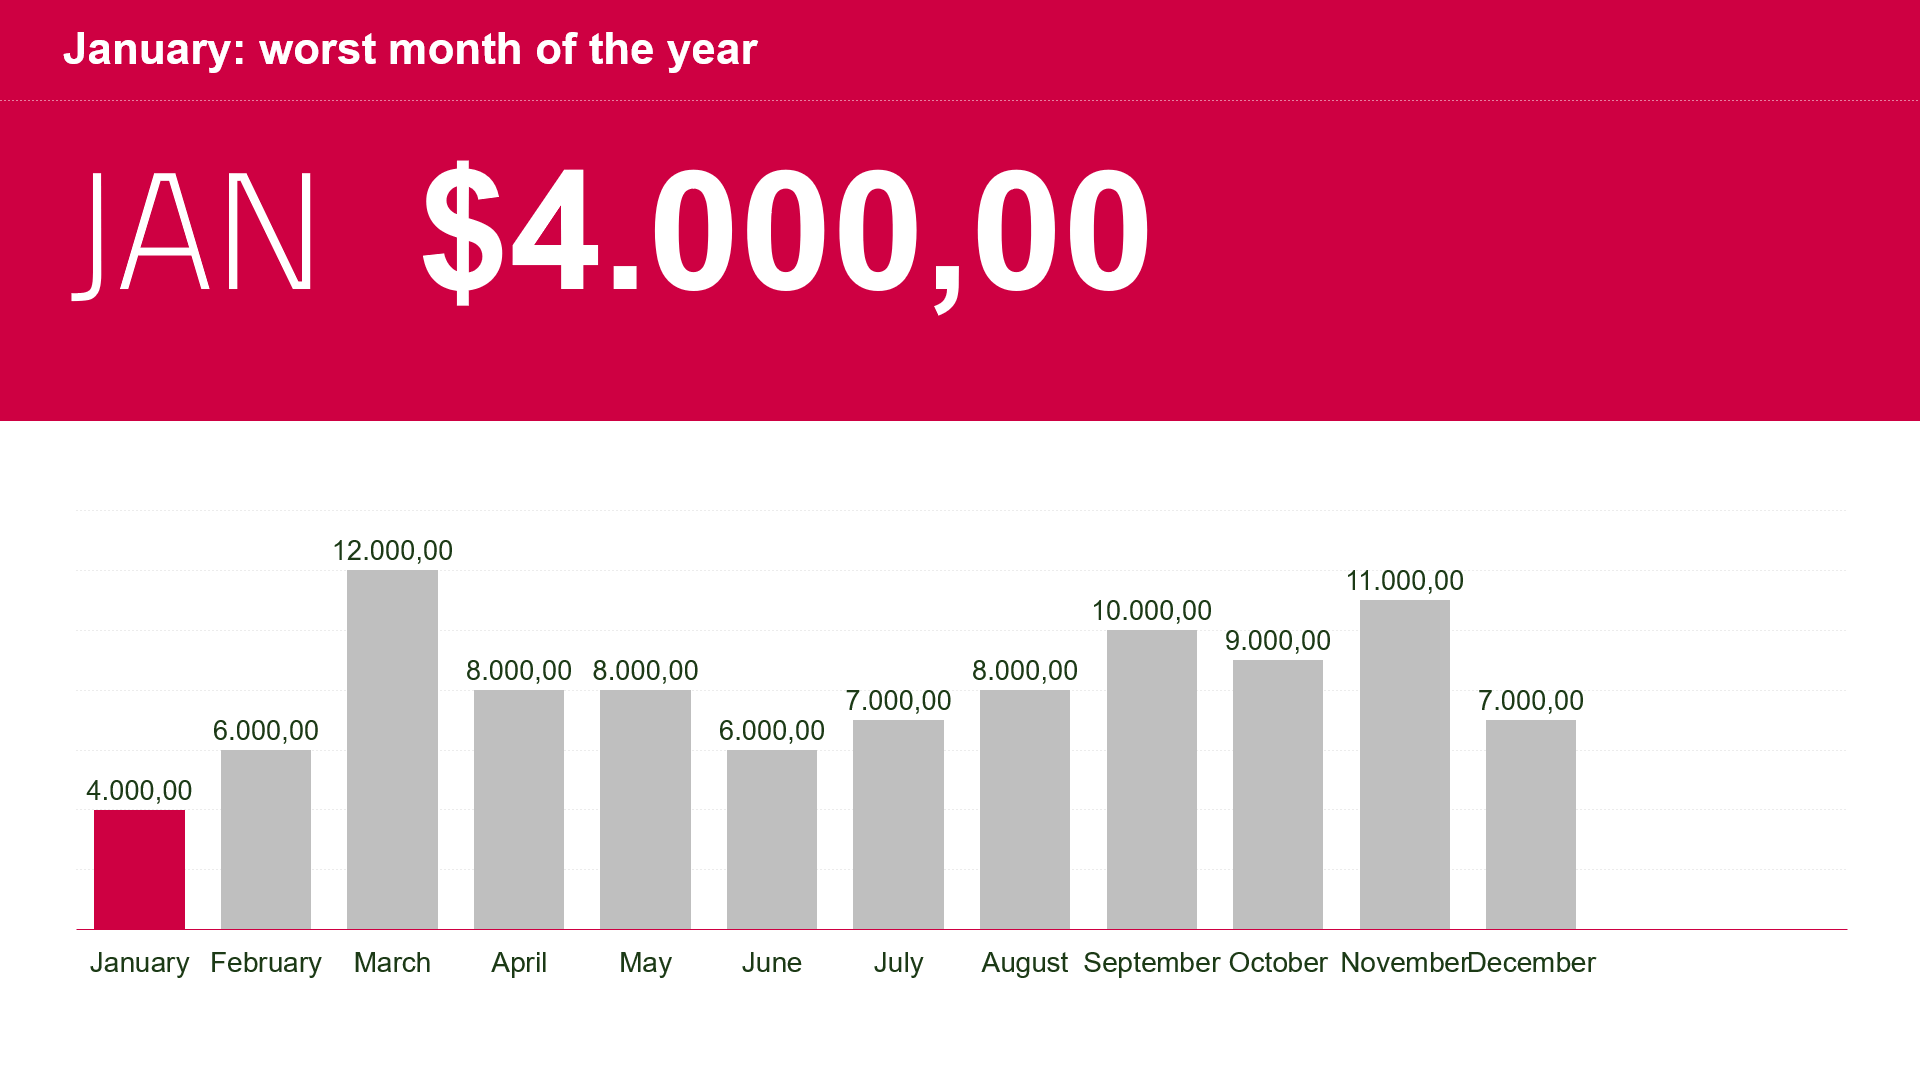
– Profitability of the month
– Balance sheet (assets, liabilities and equity)
– Expense table
– Recipe table
– Conclusions
– Next steps, measures or attitudes
– Break slides
– Finishing Slides
– Graphs editable by Excel