Already a member? Download this template in the member’s area
Breakeven Point Analysis Excel Spreadsheet Template
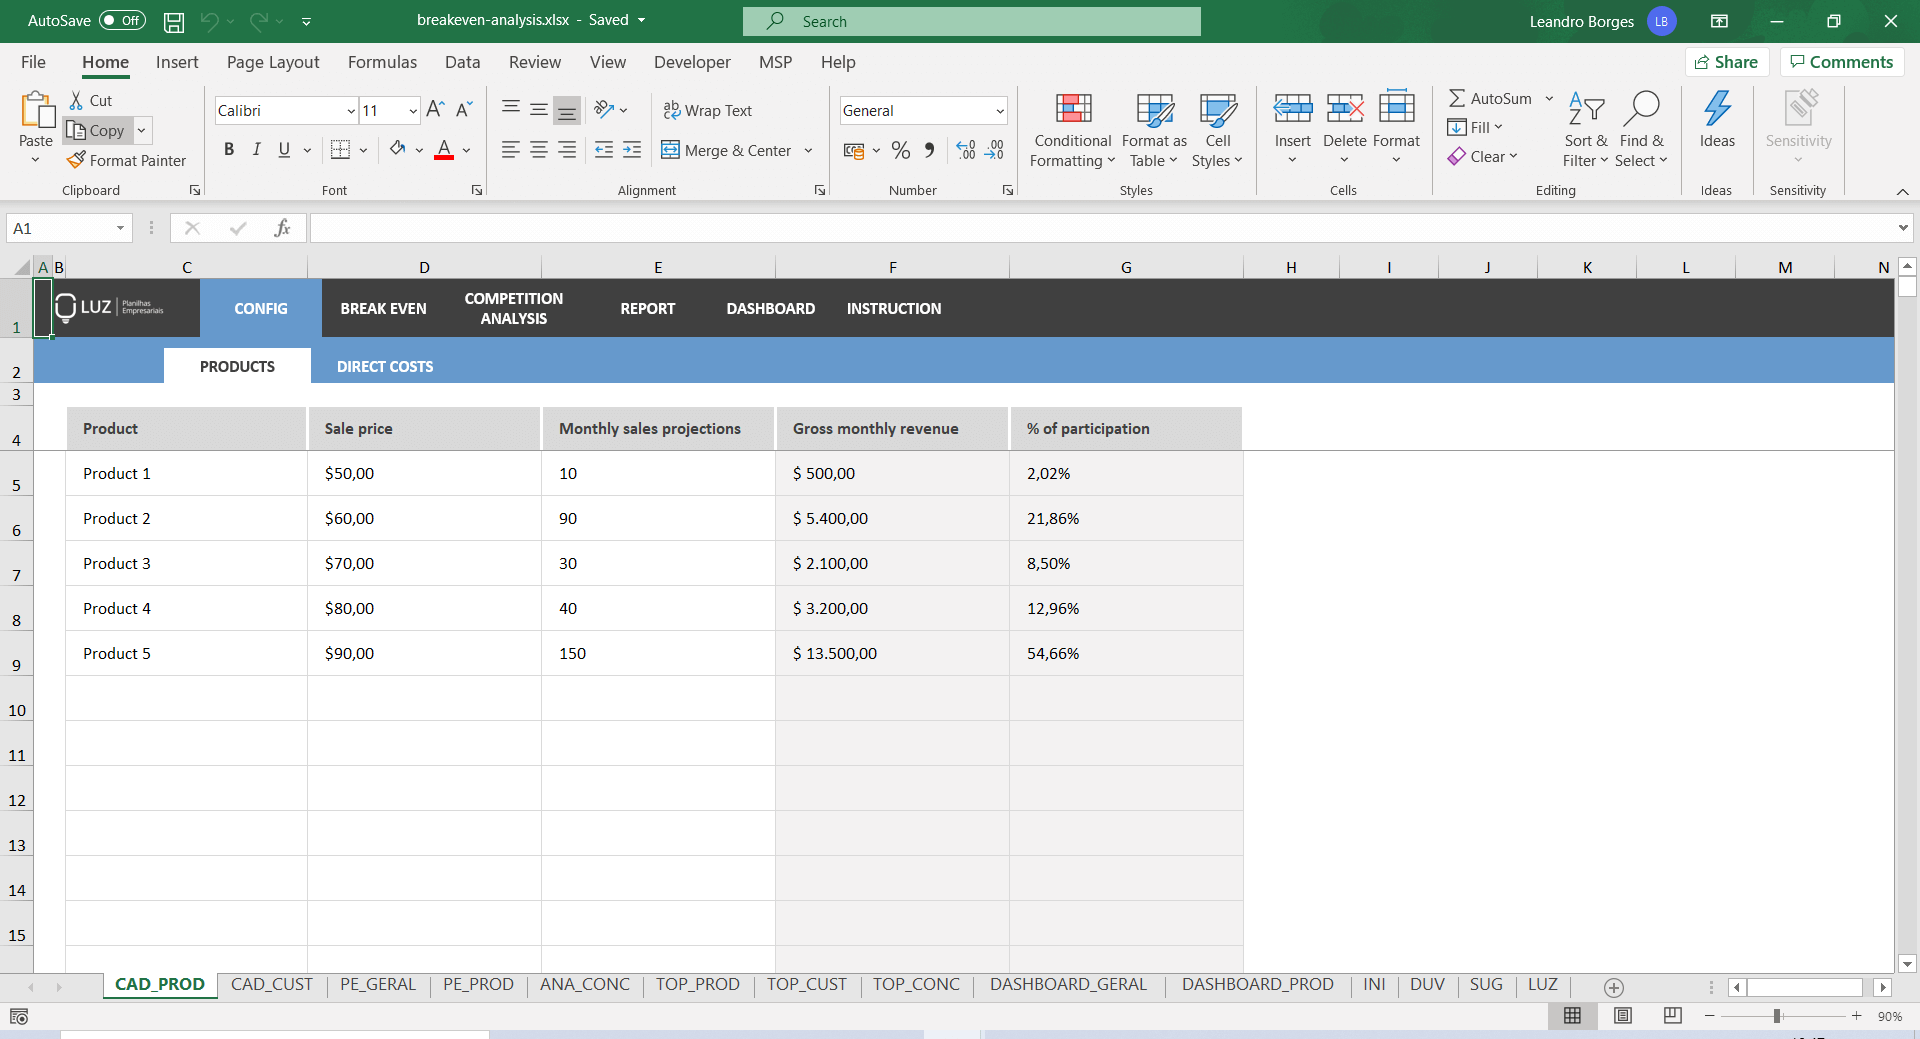
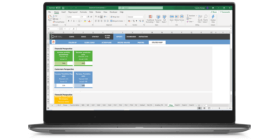
Product Registration
To start using this spreadsheet, the first step will be listing all products or services that you provide. For each of them, you will set the price and monthly sales projection.
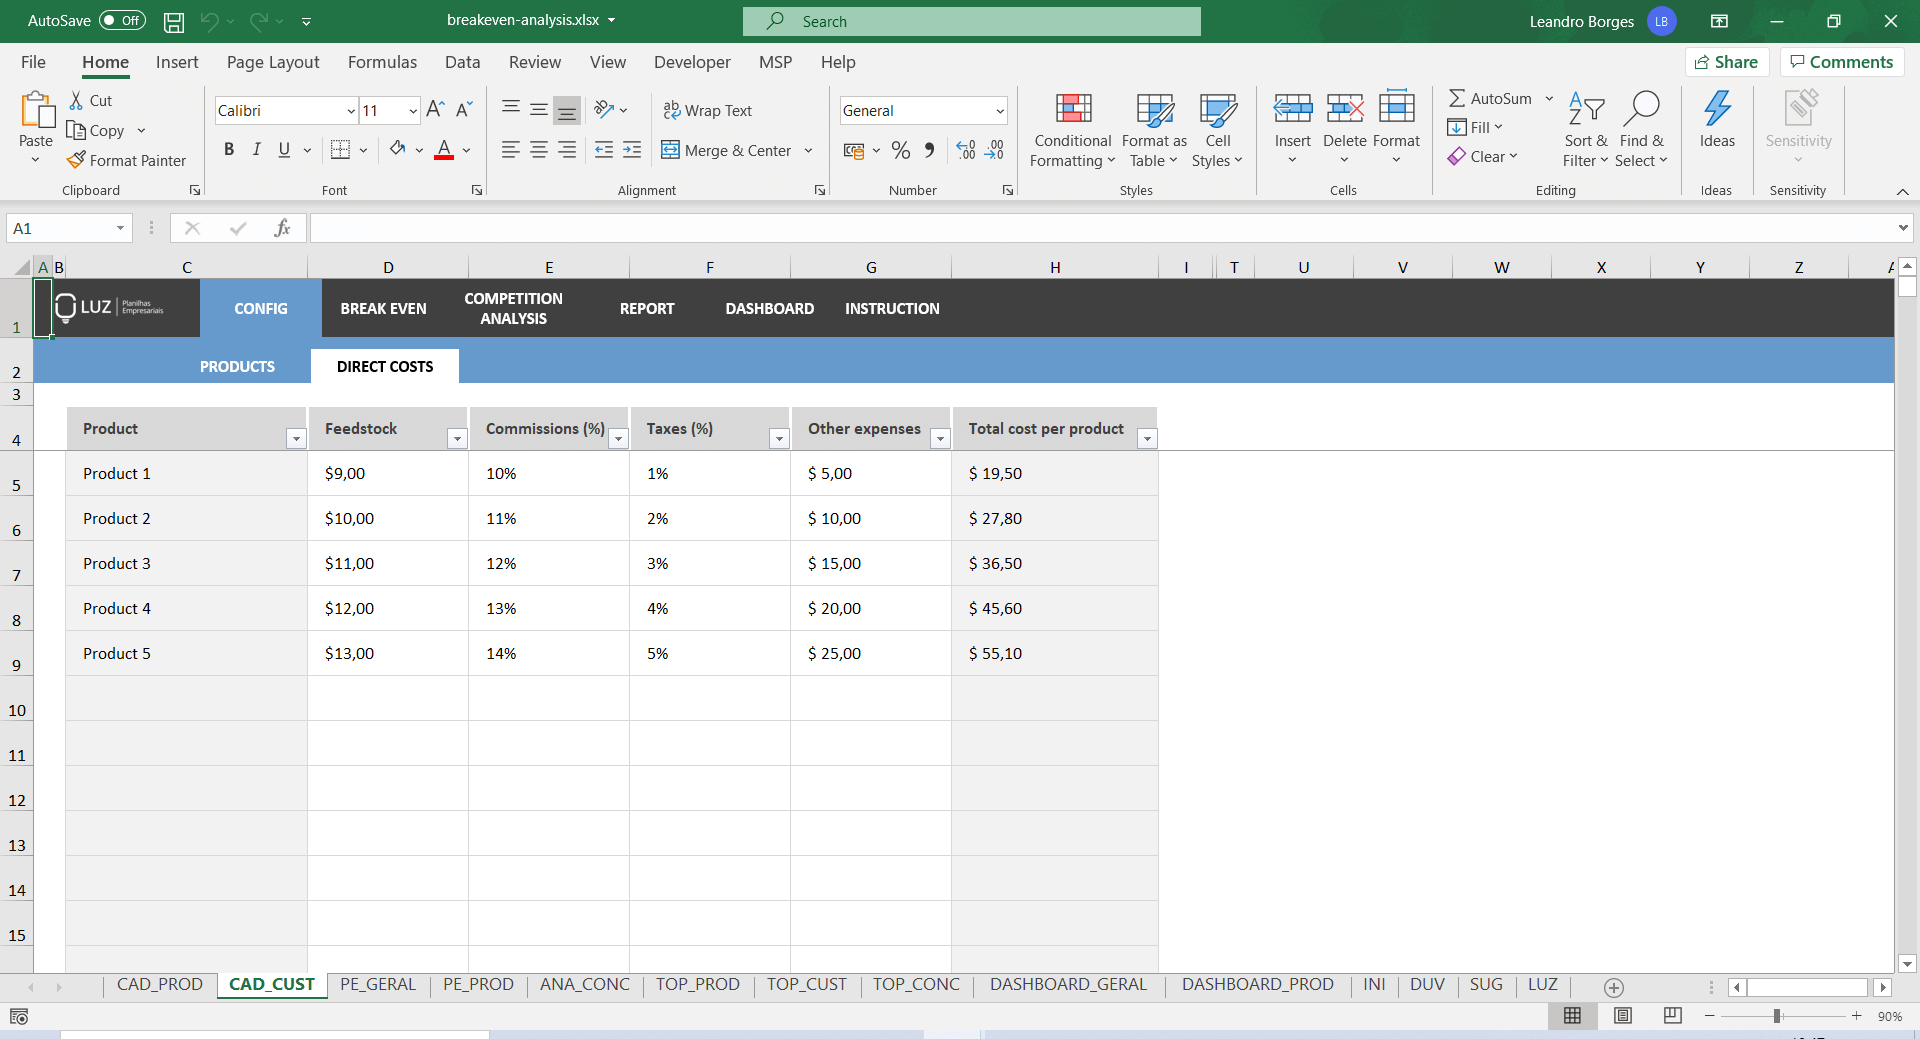
Direct Costs
Just as the first tab, you will start with the previous product/service list and will add all direct costs such as feedstock, commissions, and taxes.
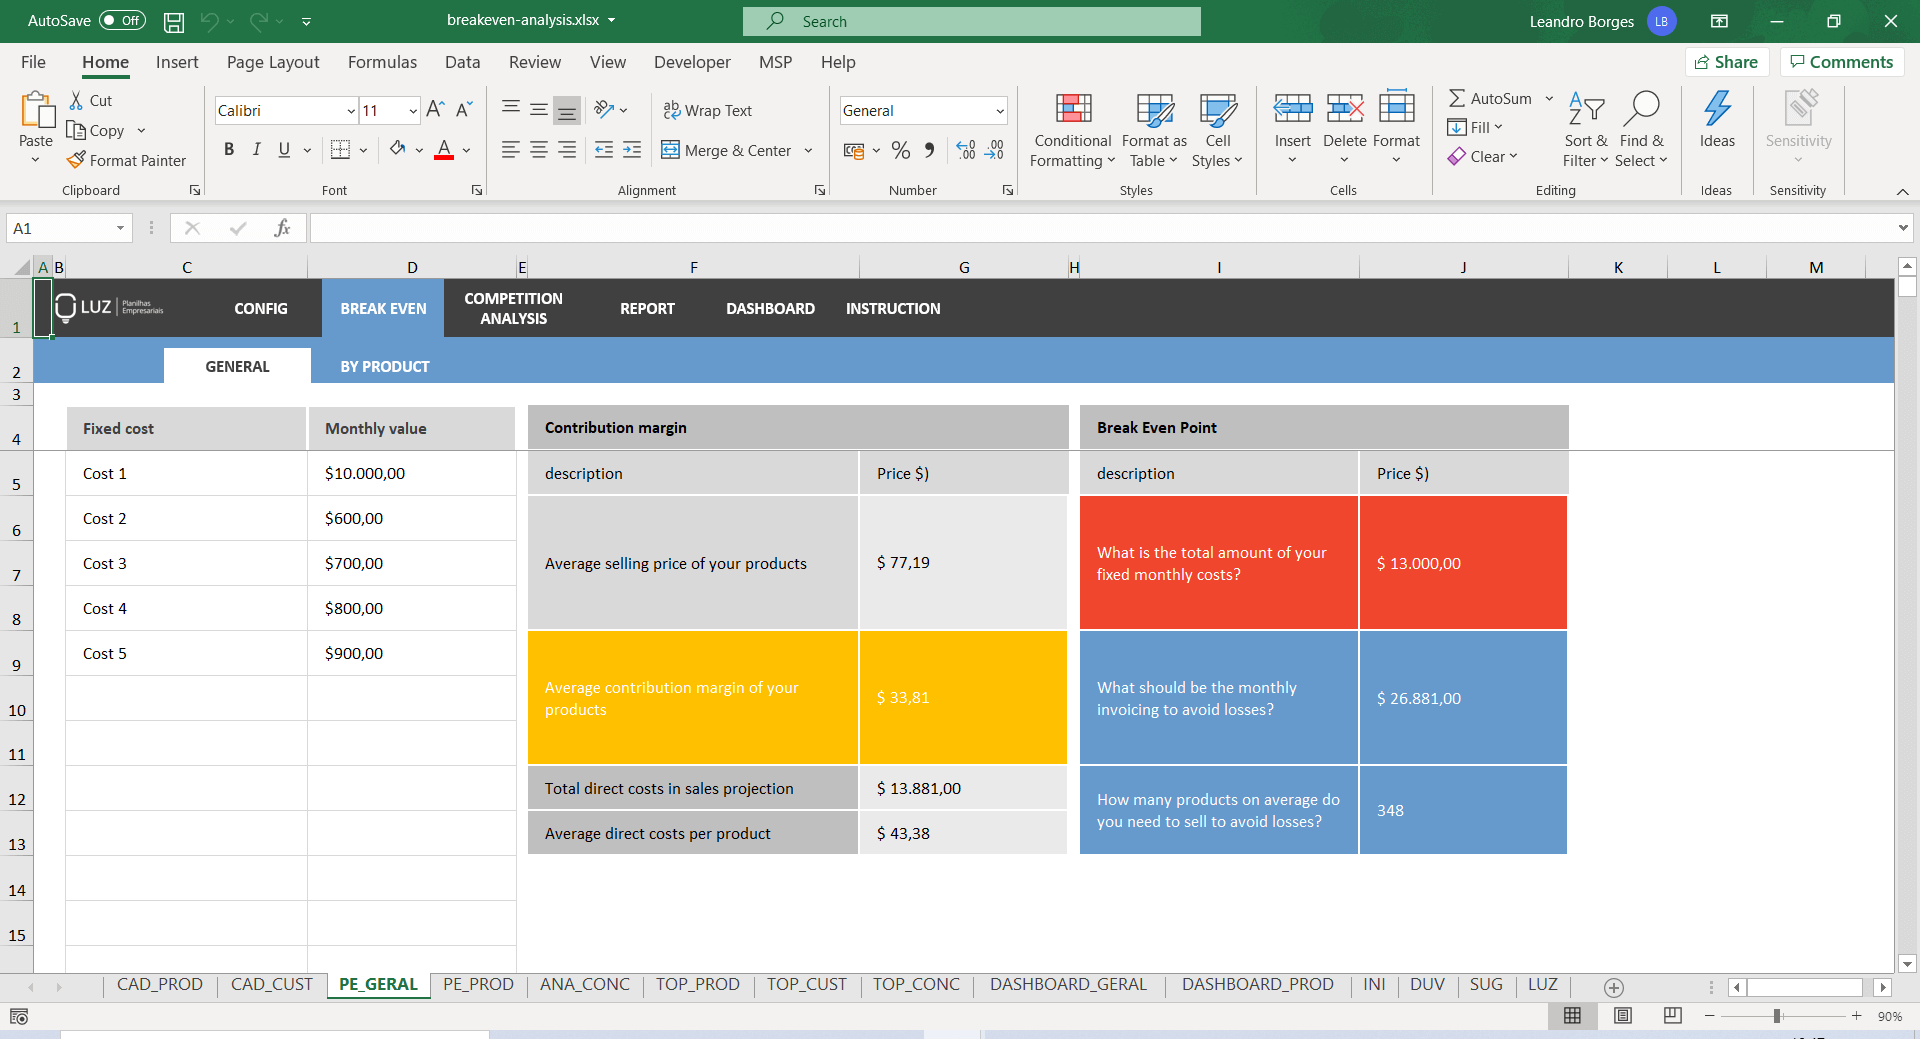
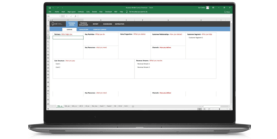
Breakeven Point Analysis
To set the last variant on the breakeven analysis formula, you will now have to list all fixed costs of your business, this usually includes rent, wages, accounting firm, etc.
Automatically, on this same tab, you will get your contribution margin and your breakeven point both financially and the volume needed to be sold.
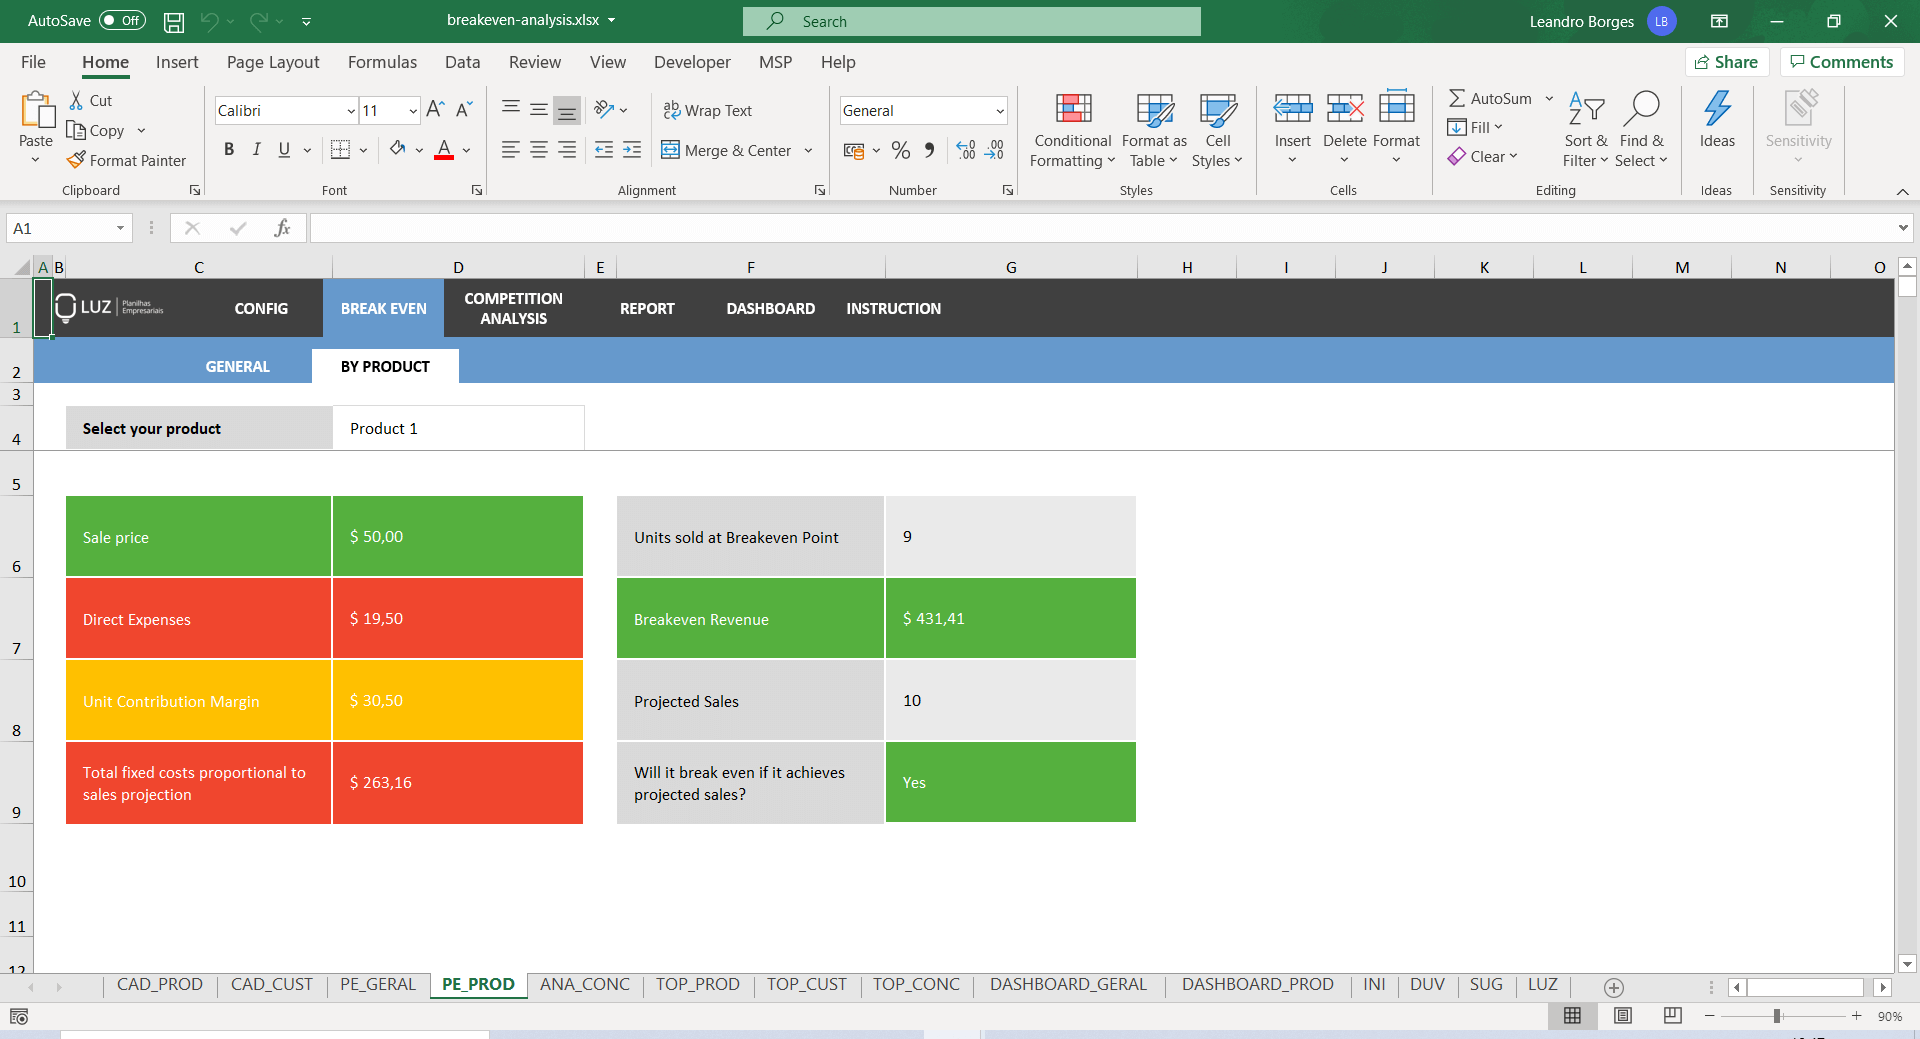
Breakeven Point by Product
In addition to the general analysis of the breakeven point of your company, you can make specific analyzes for each of the products registered in the spreadsheet.
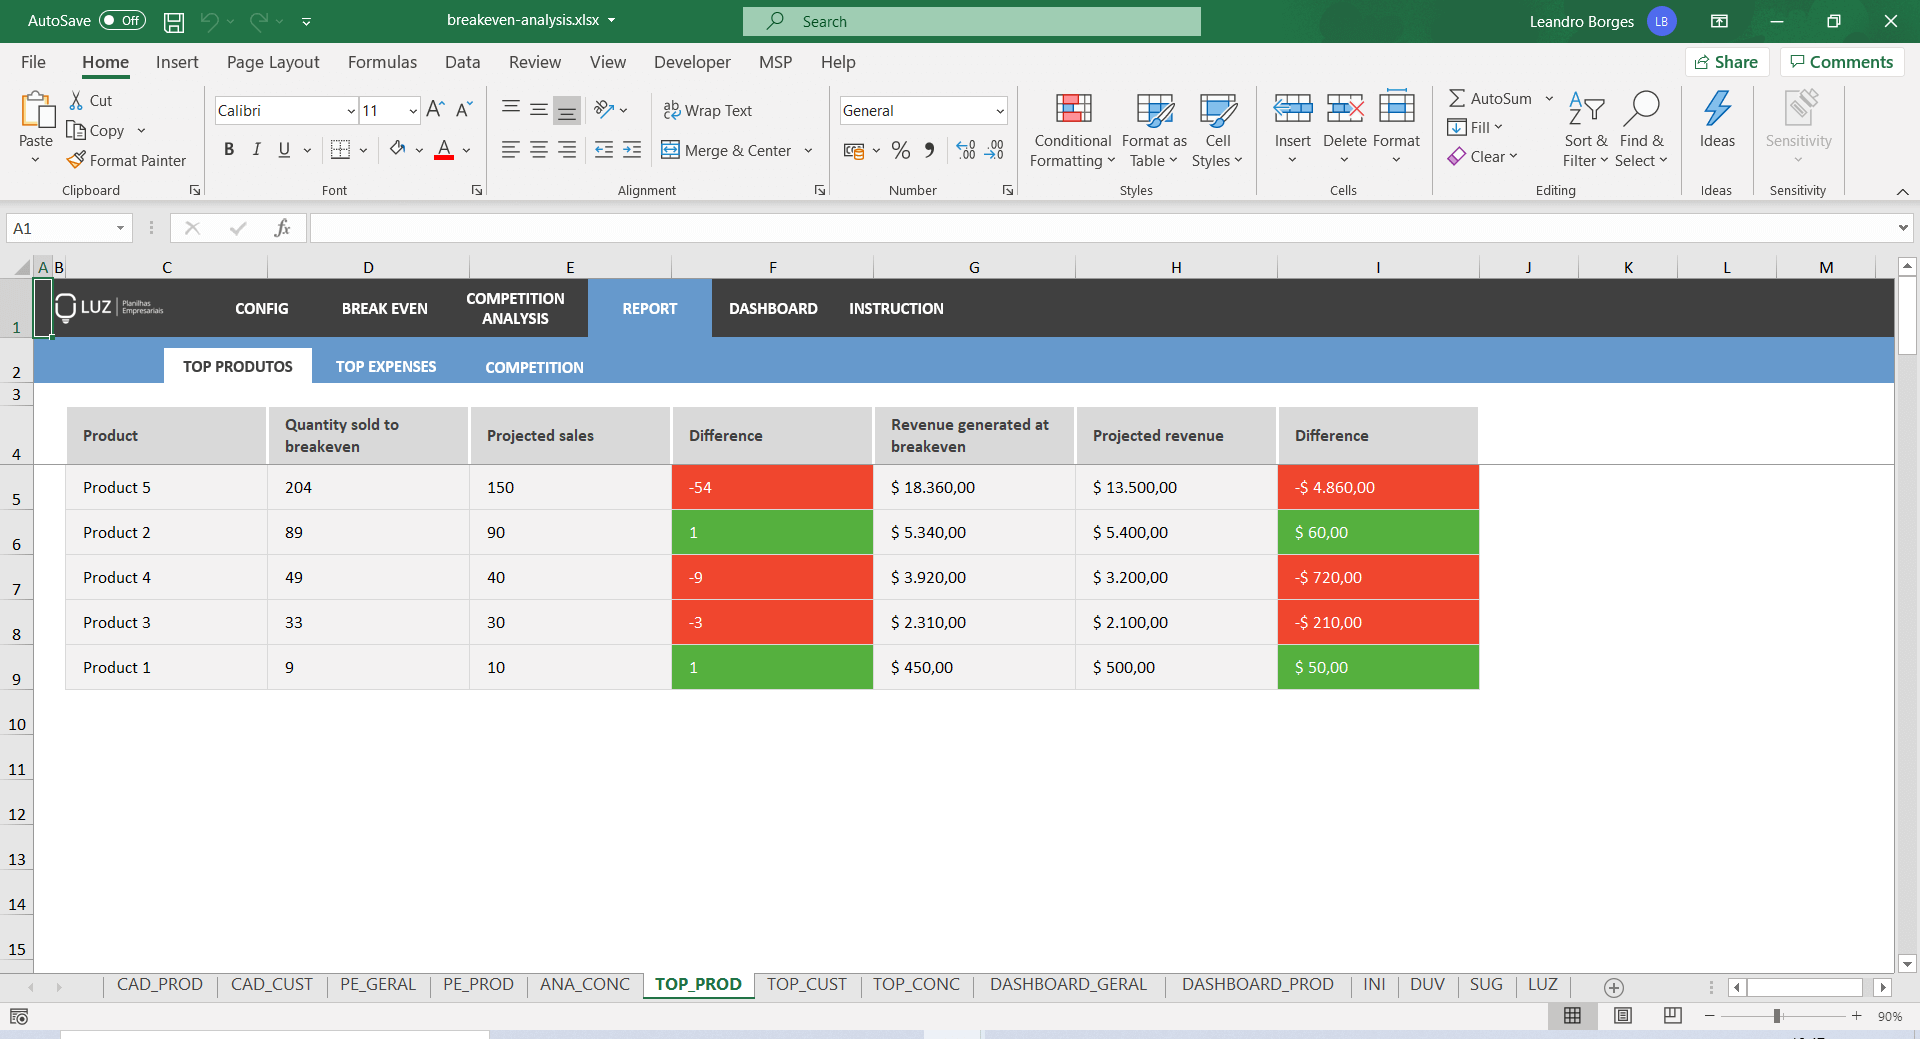
Product or Service Analysis Reports
Track the difference between projected sales and revenues versus what you need to get to break even.
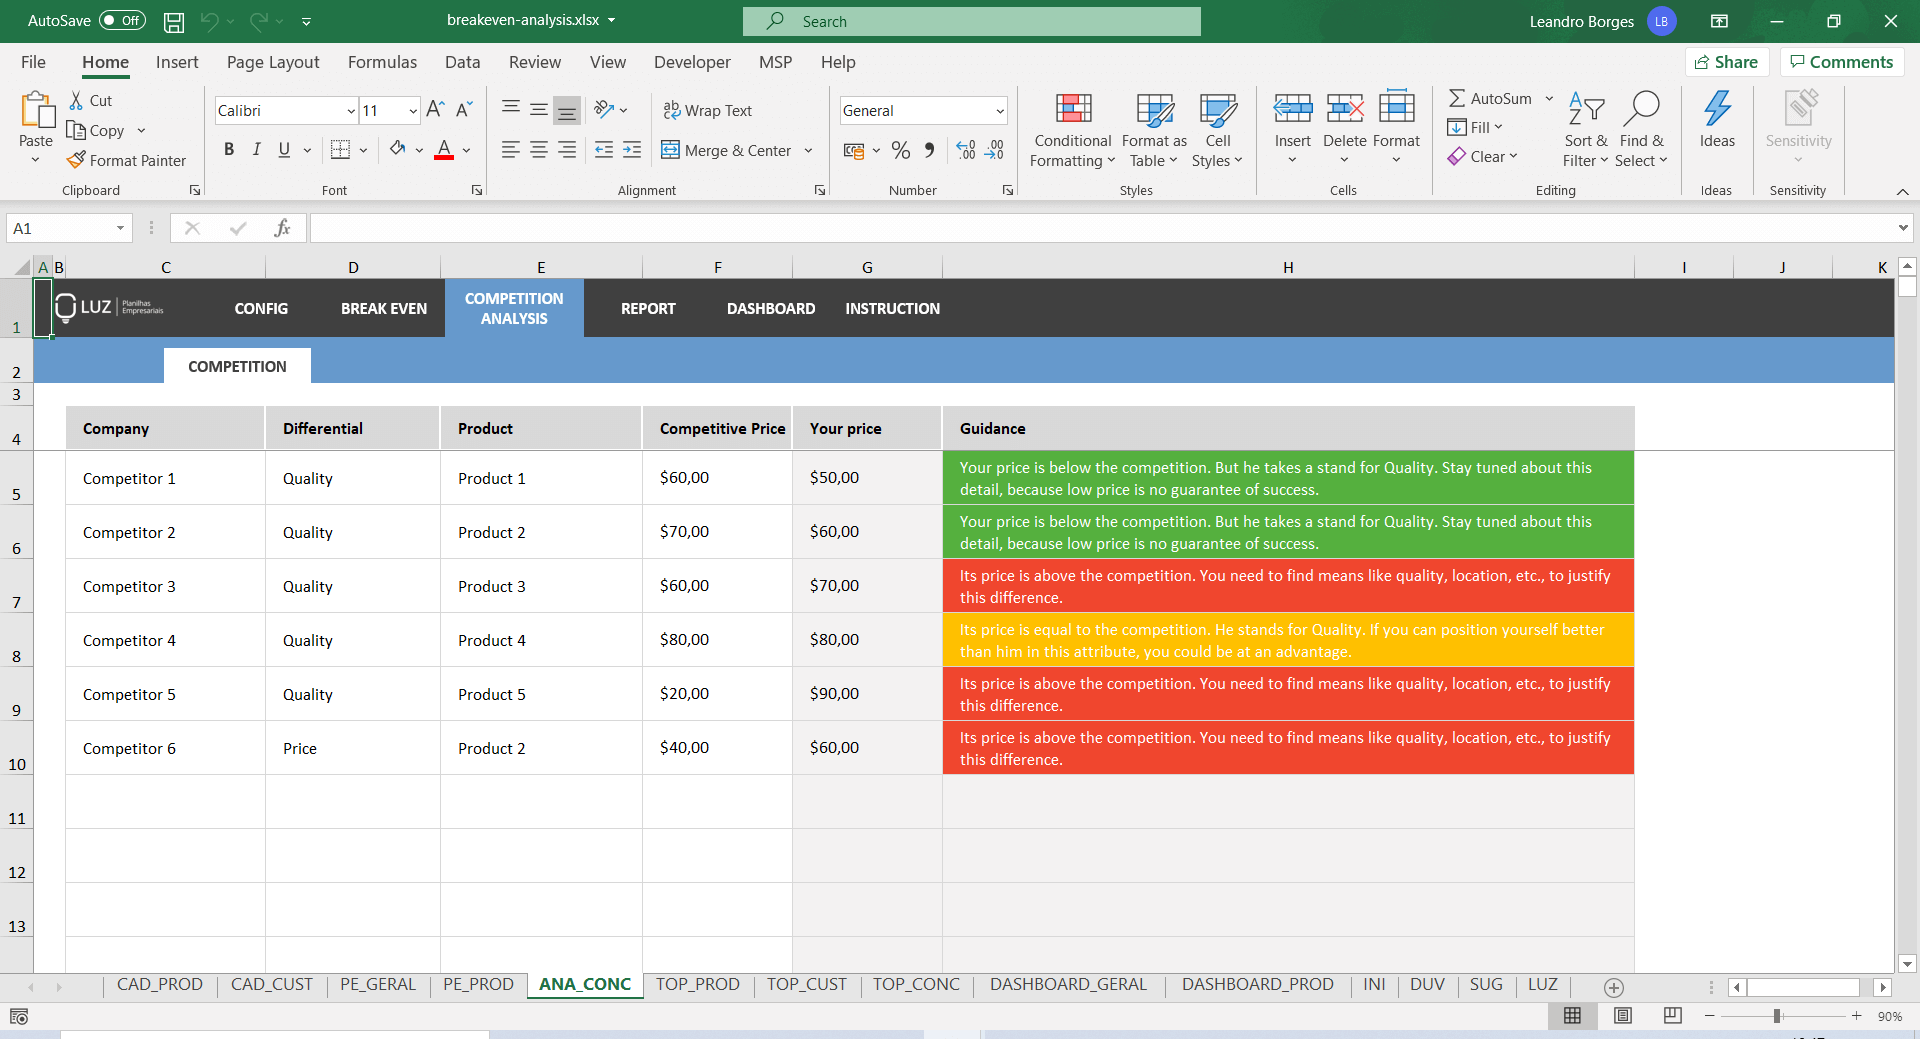
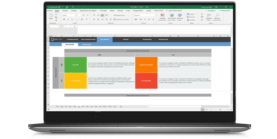
Competitor Analysis
Compare your price and positioning with that of your competitors and receive personalized advice.
Expense Report
A ranking showing the highest costs of your business both direct and fixed ones.
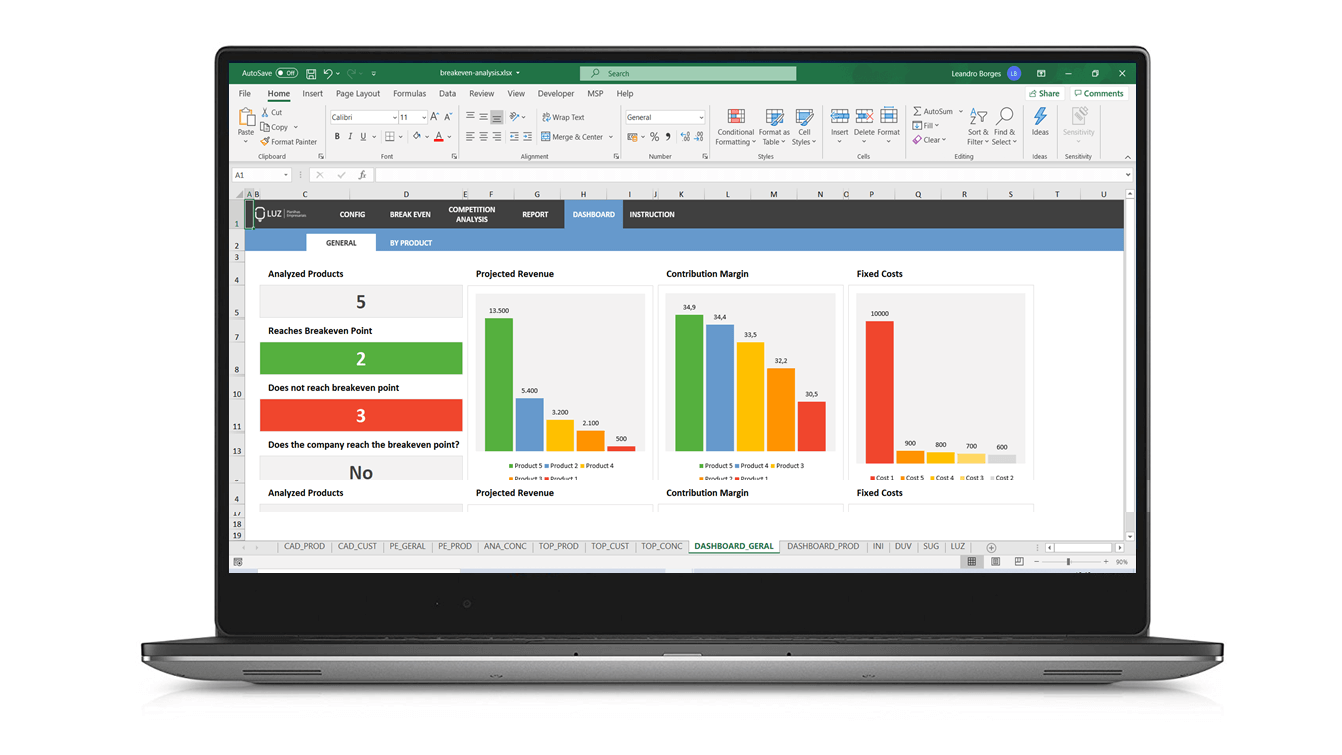
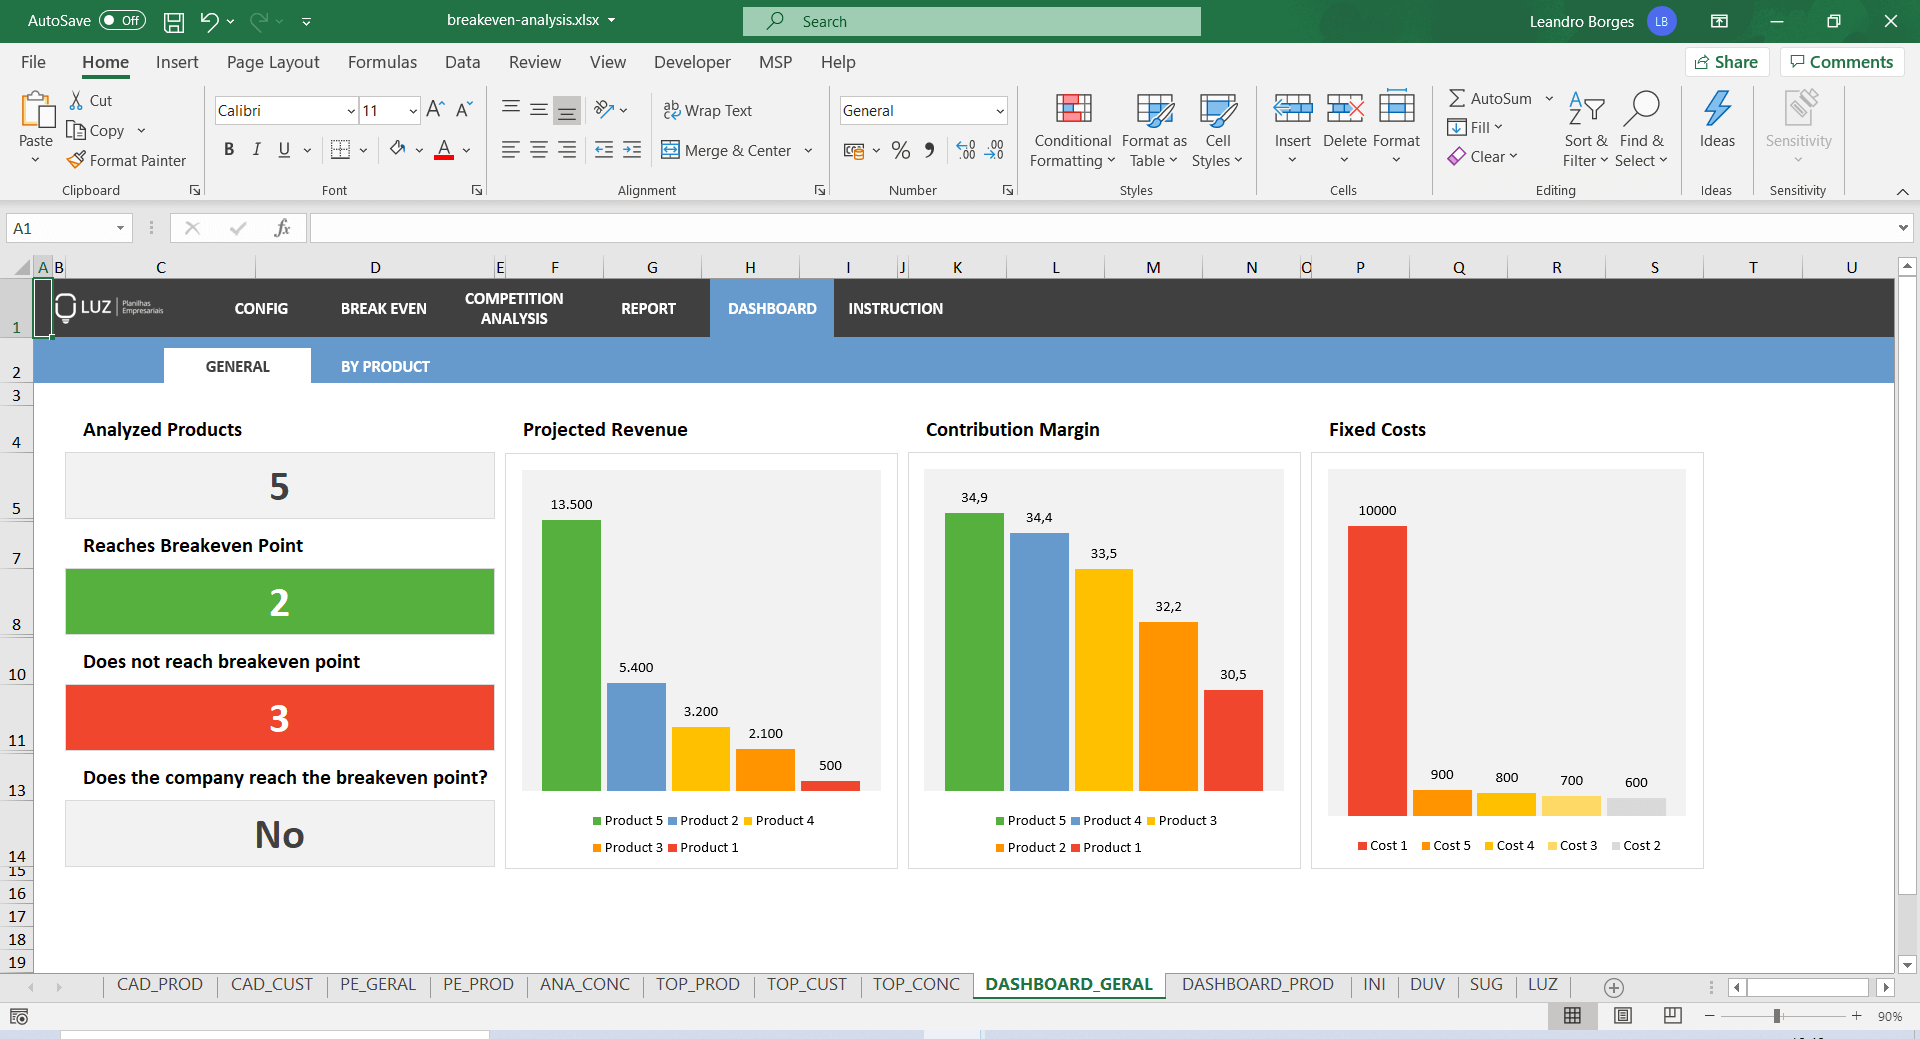
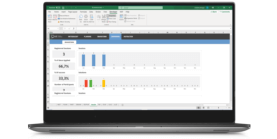
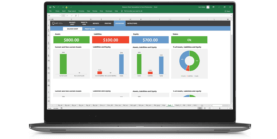
General Dashboard
This will show the number of products registered, how many reached the break-even point and create comparisons charts between the average sales figures, fixed costs, and contribution margin
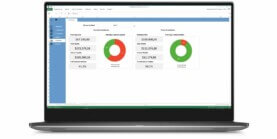
Product Review Dashboard
Choose a product and see the main indicators it has when it reaches break-even and follow charts comparing it to the average of other products
Breakeven Point Analysis Excel Spreadsheet Template