Fishbone Diagram (Ishikawa) Excel Spreadsheet Template
The Ishikawa (Cause and Effect) diagram will help you to organize the problems of the tour company, plan corrective actions and control your results.
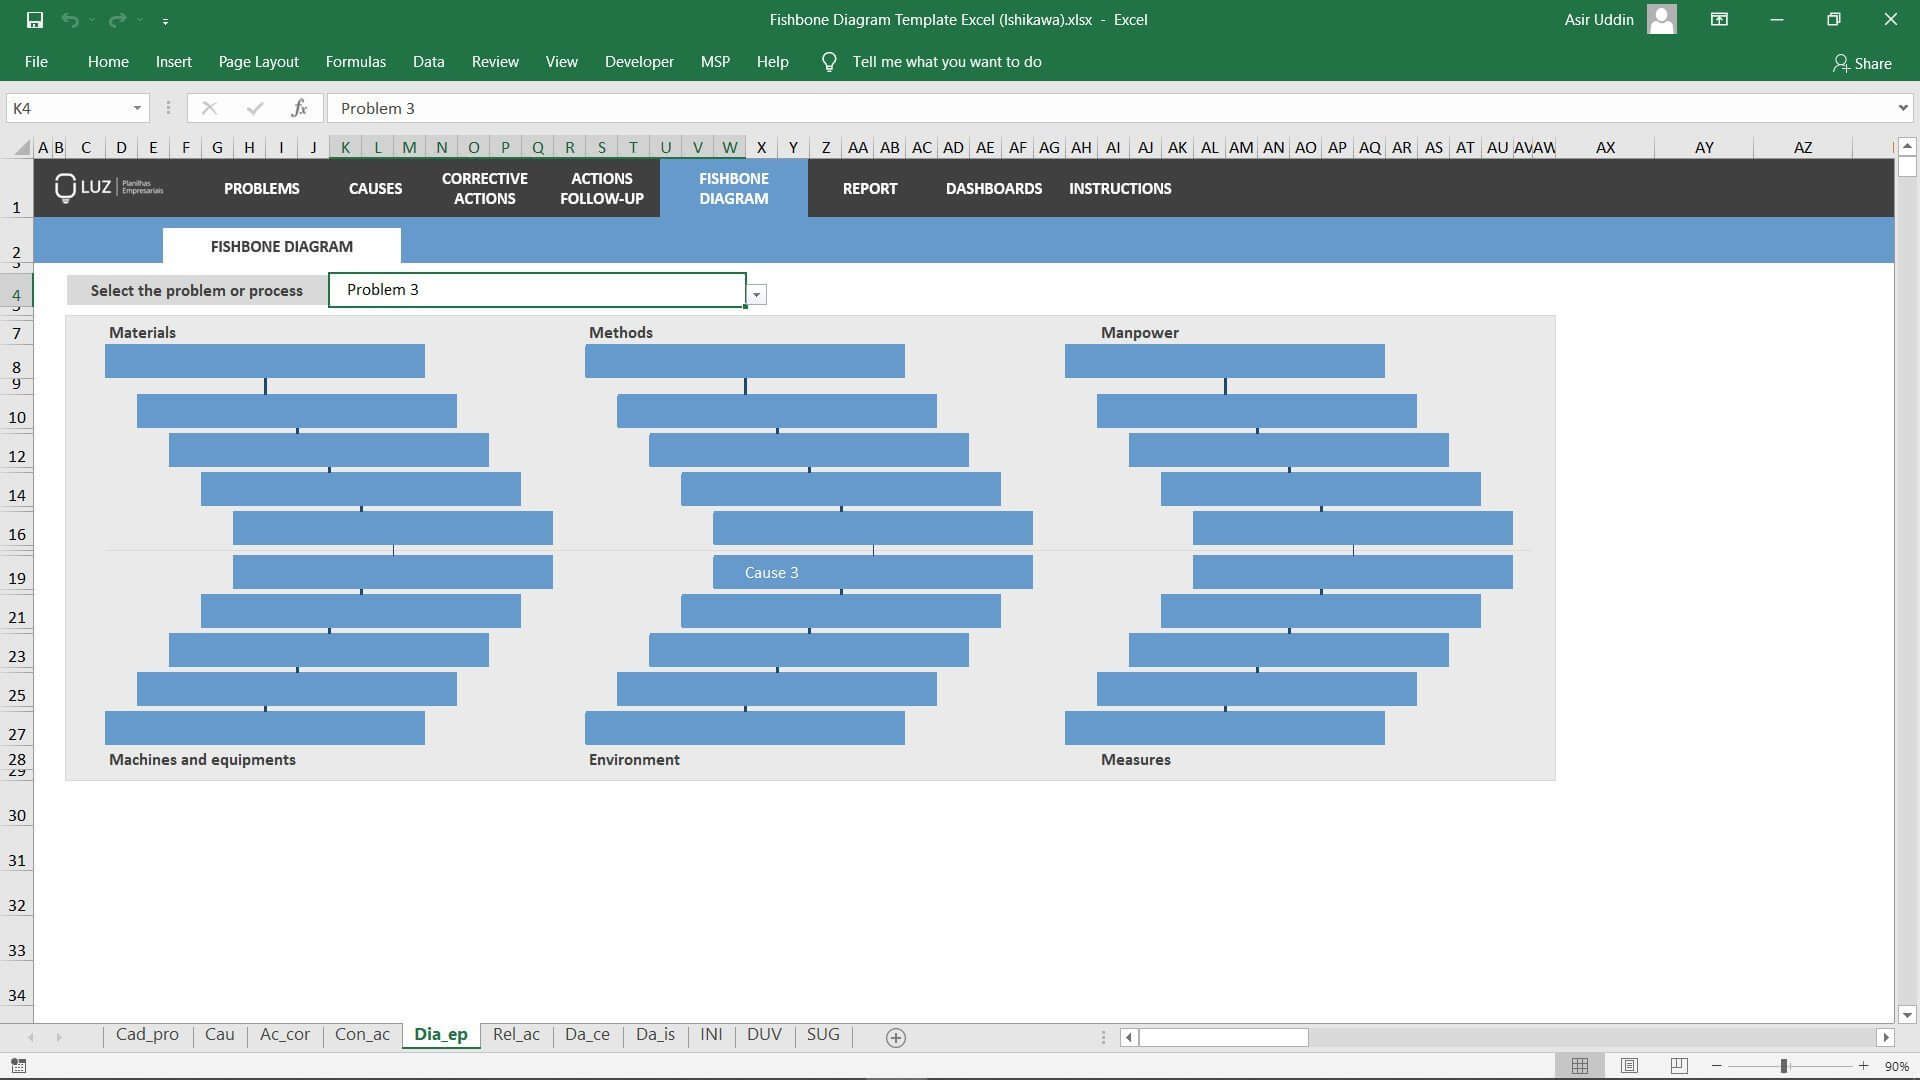
Ishikawa’s Diagram (Fishbone)
The worksheet automatically generates a graphical view of your Ishikawa Diagram (Cause and Effect) in the Fishbone format. This Diagram helps you to see the causes of the selected problem and can be printed for use in reports.
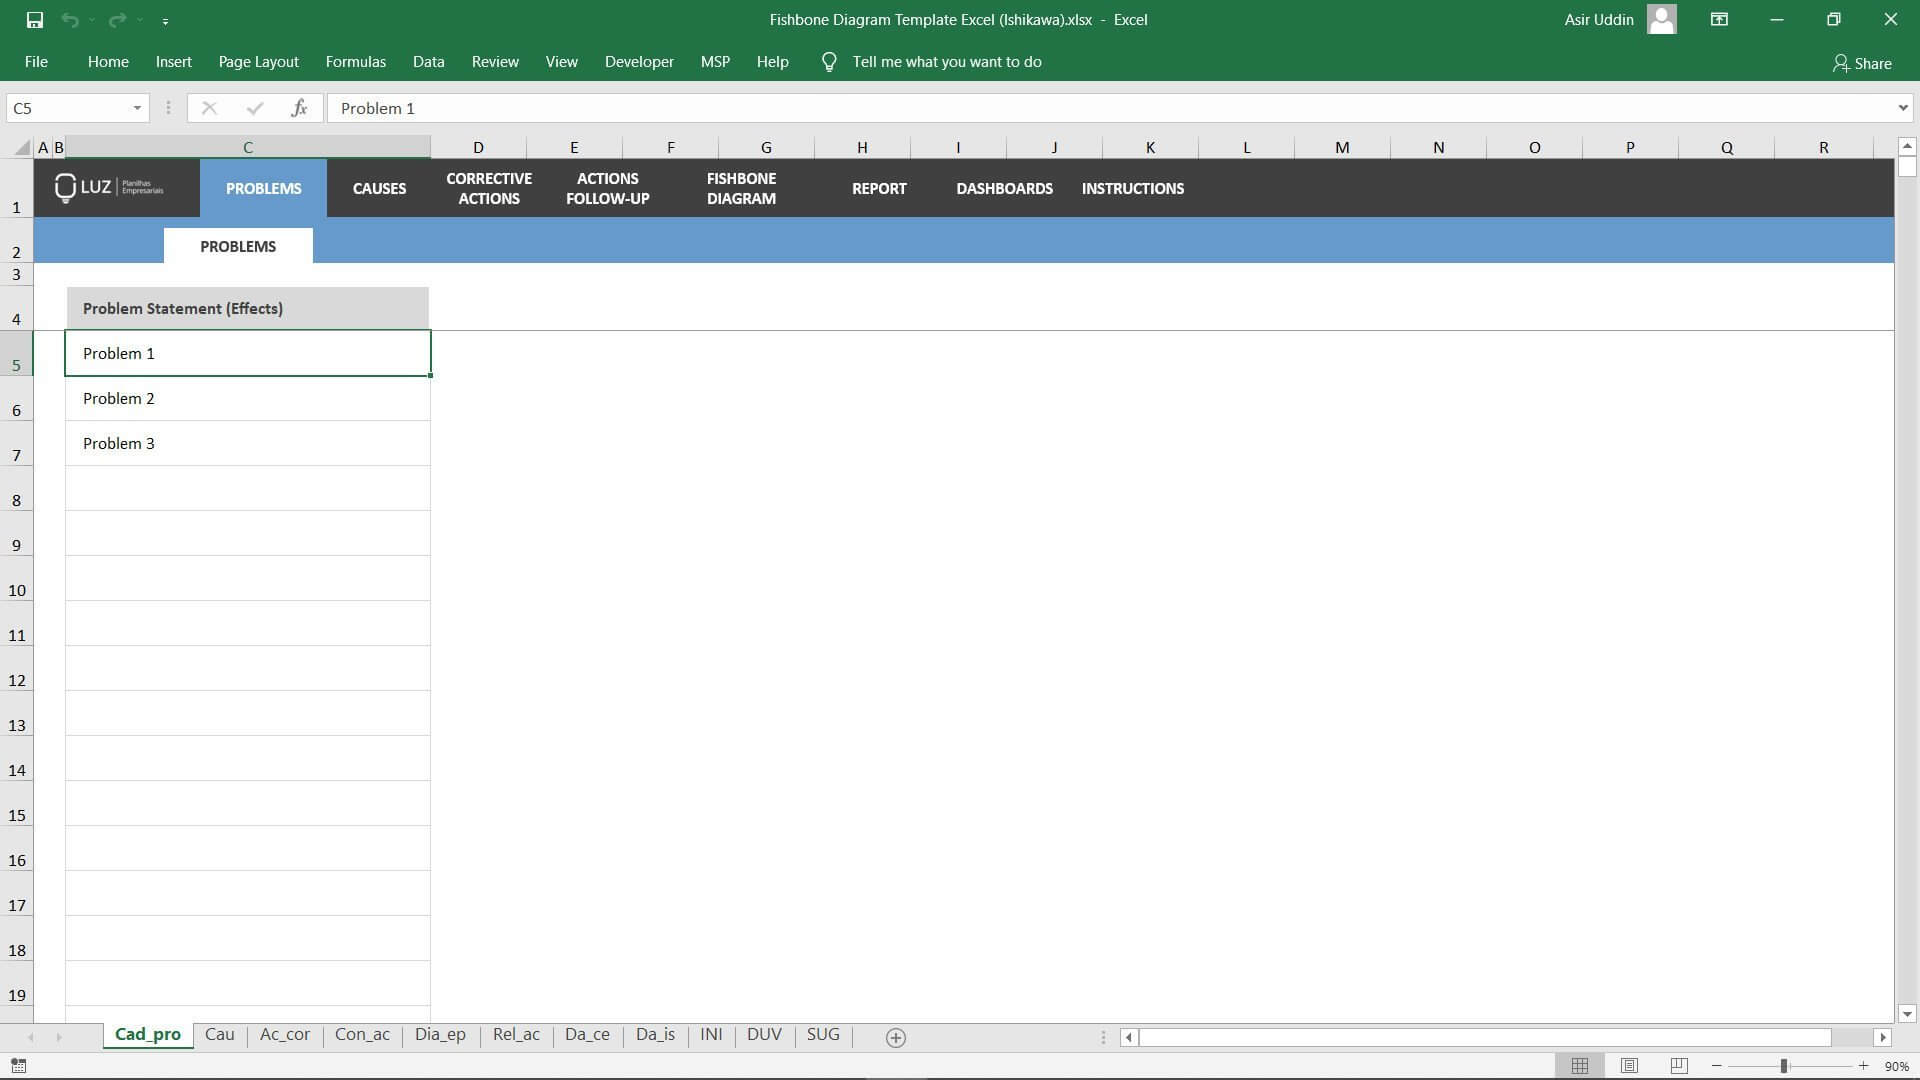
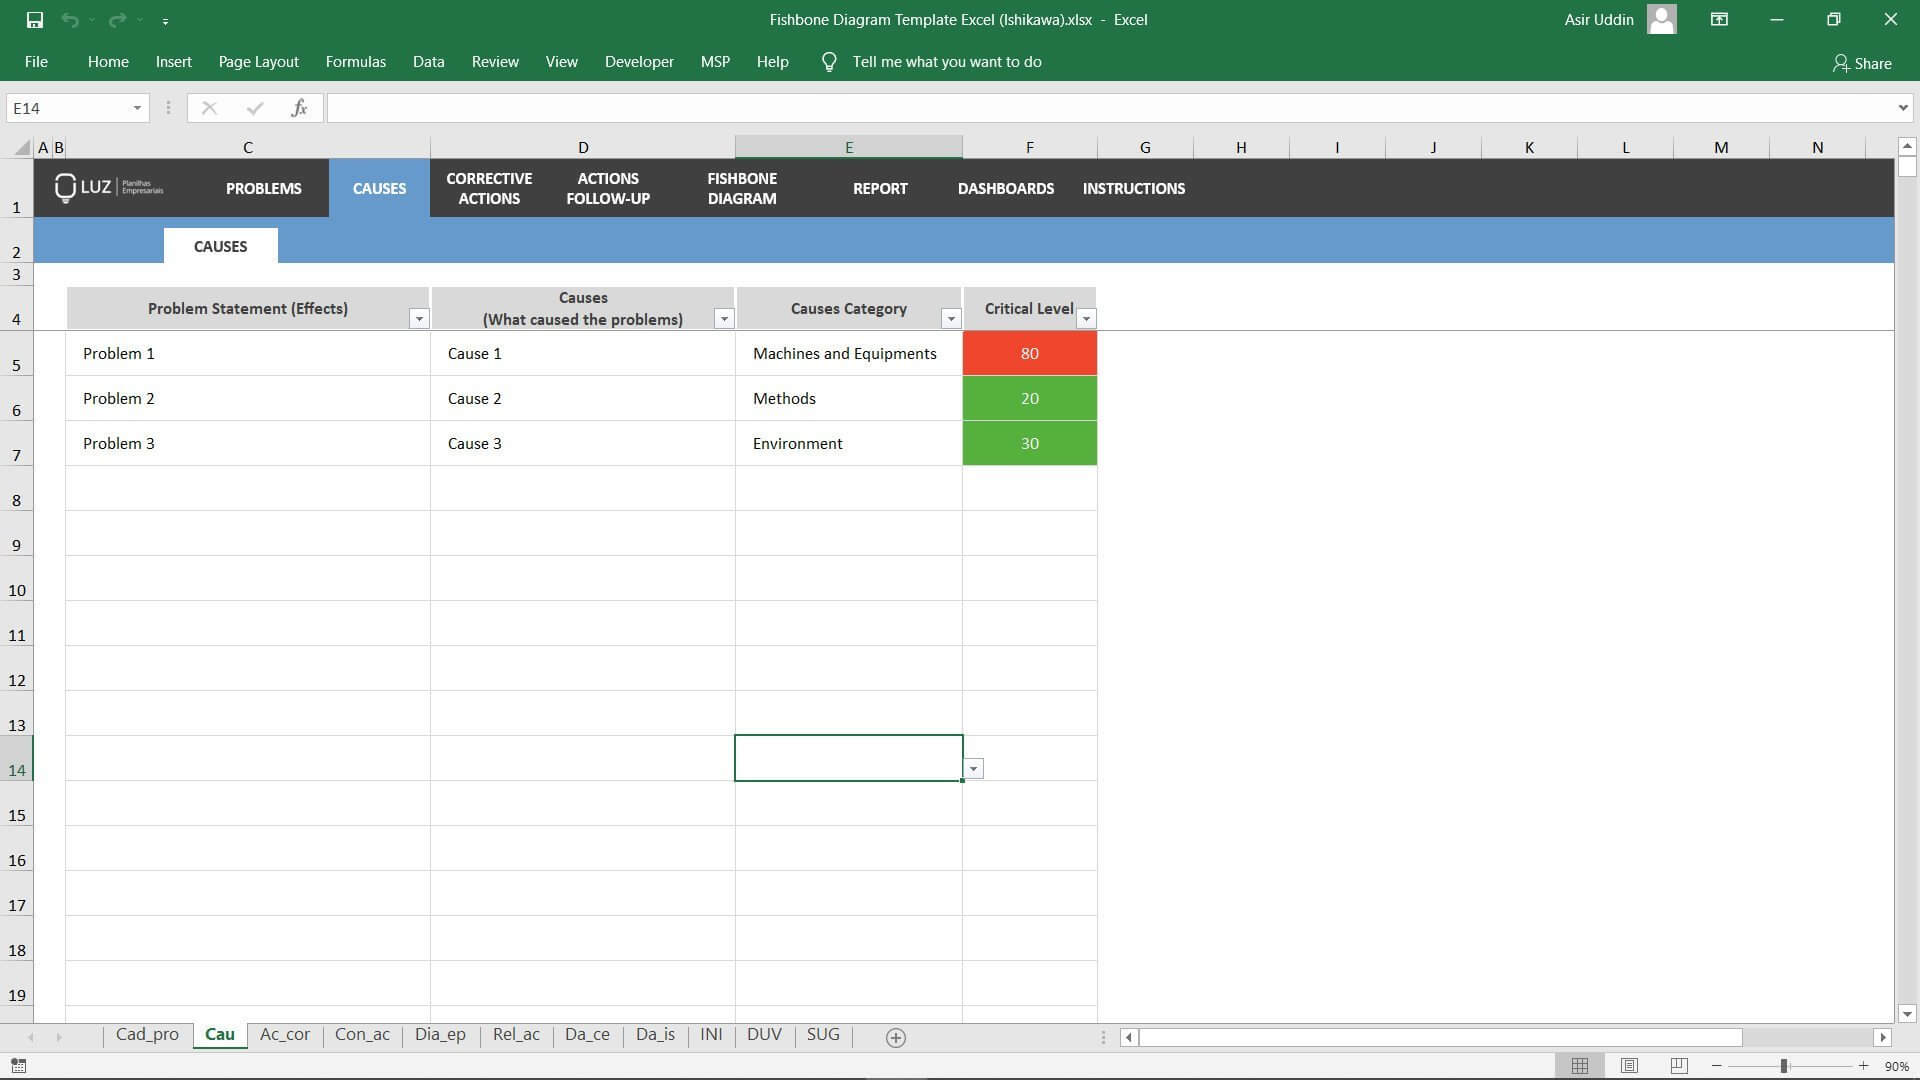
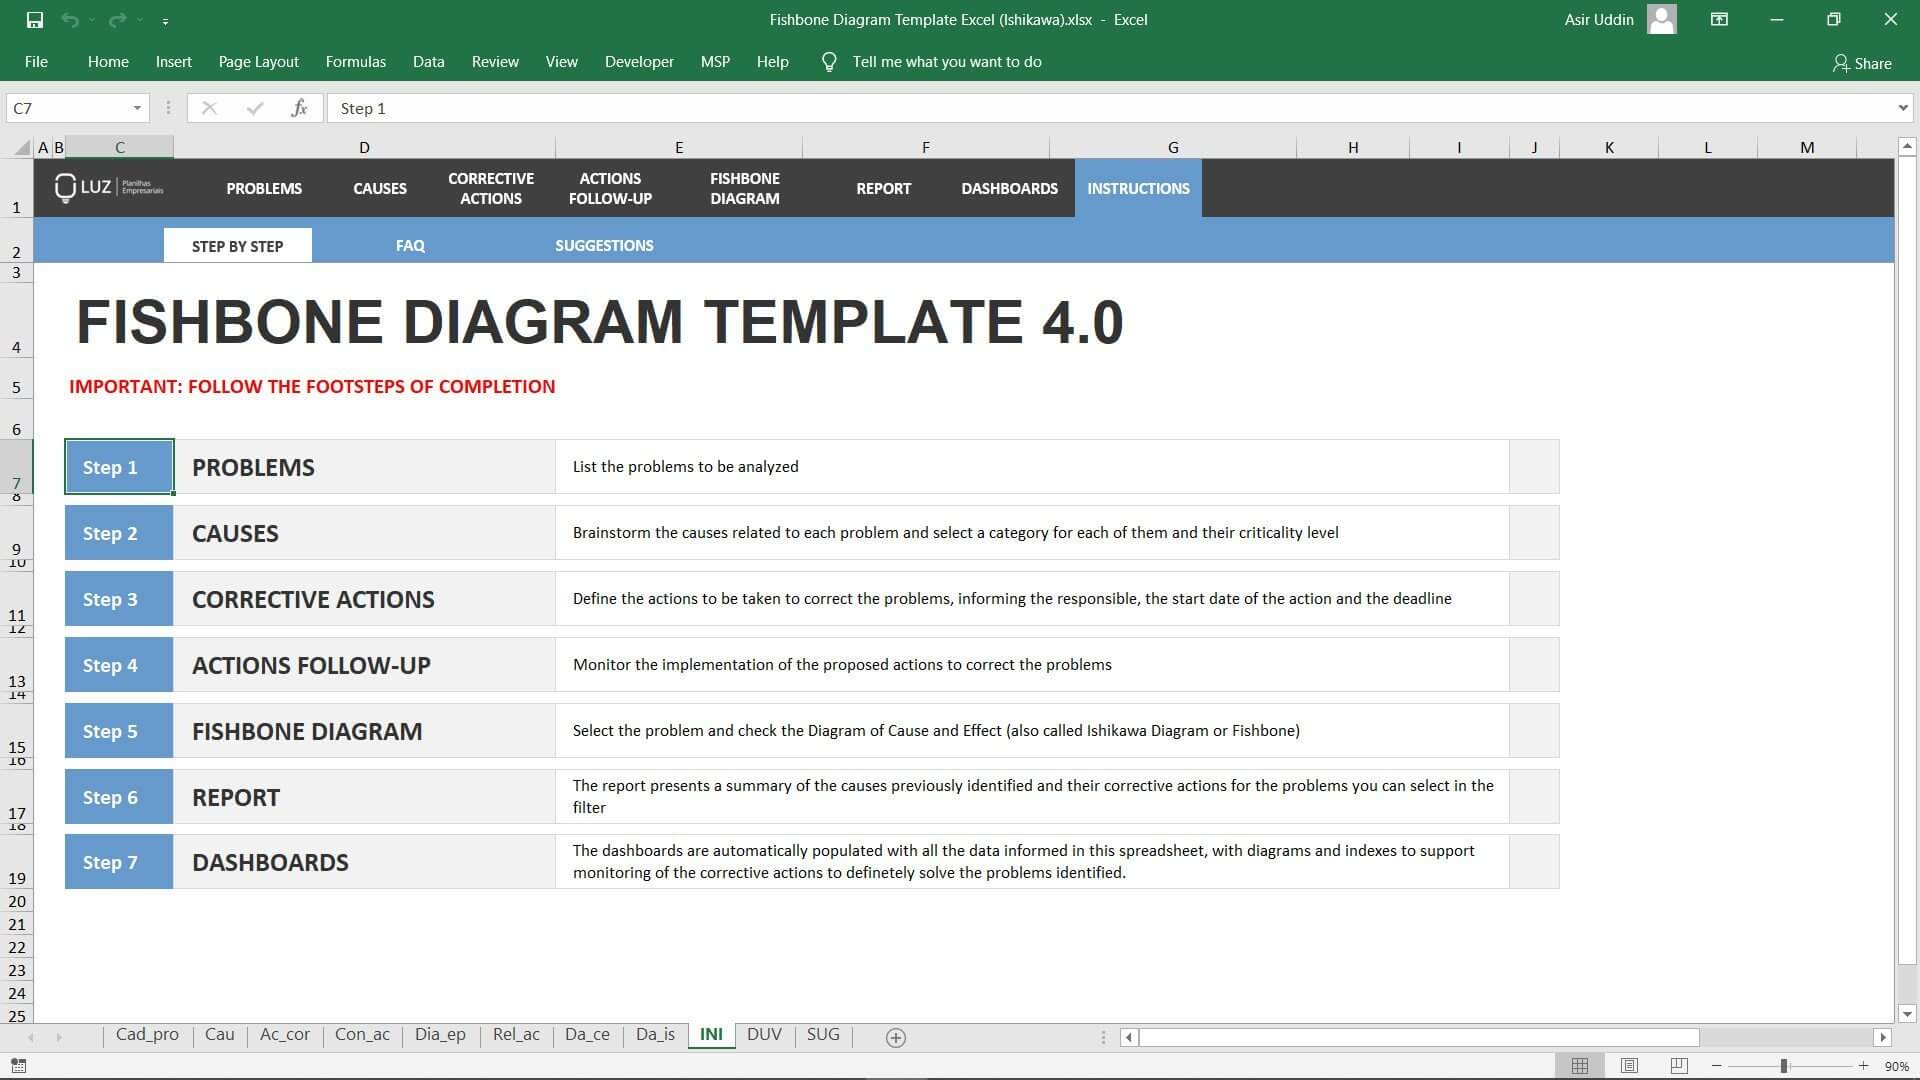
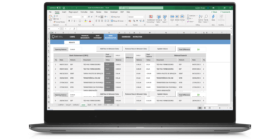
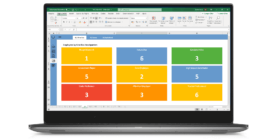
Registration of Problems and their Causes
In the first part of the worksheet, you will define which problems should be solved and address the main causes for them, based on 6M: Materials, Methods, Manpower, Machinery and Equipment, Environment and Measurement. It is also possible to punctuate each cause individually, to prioritize the resolution of the most important ones.
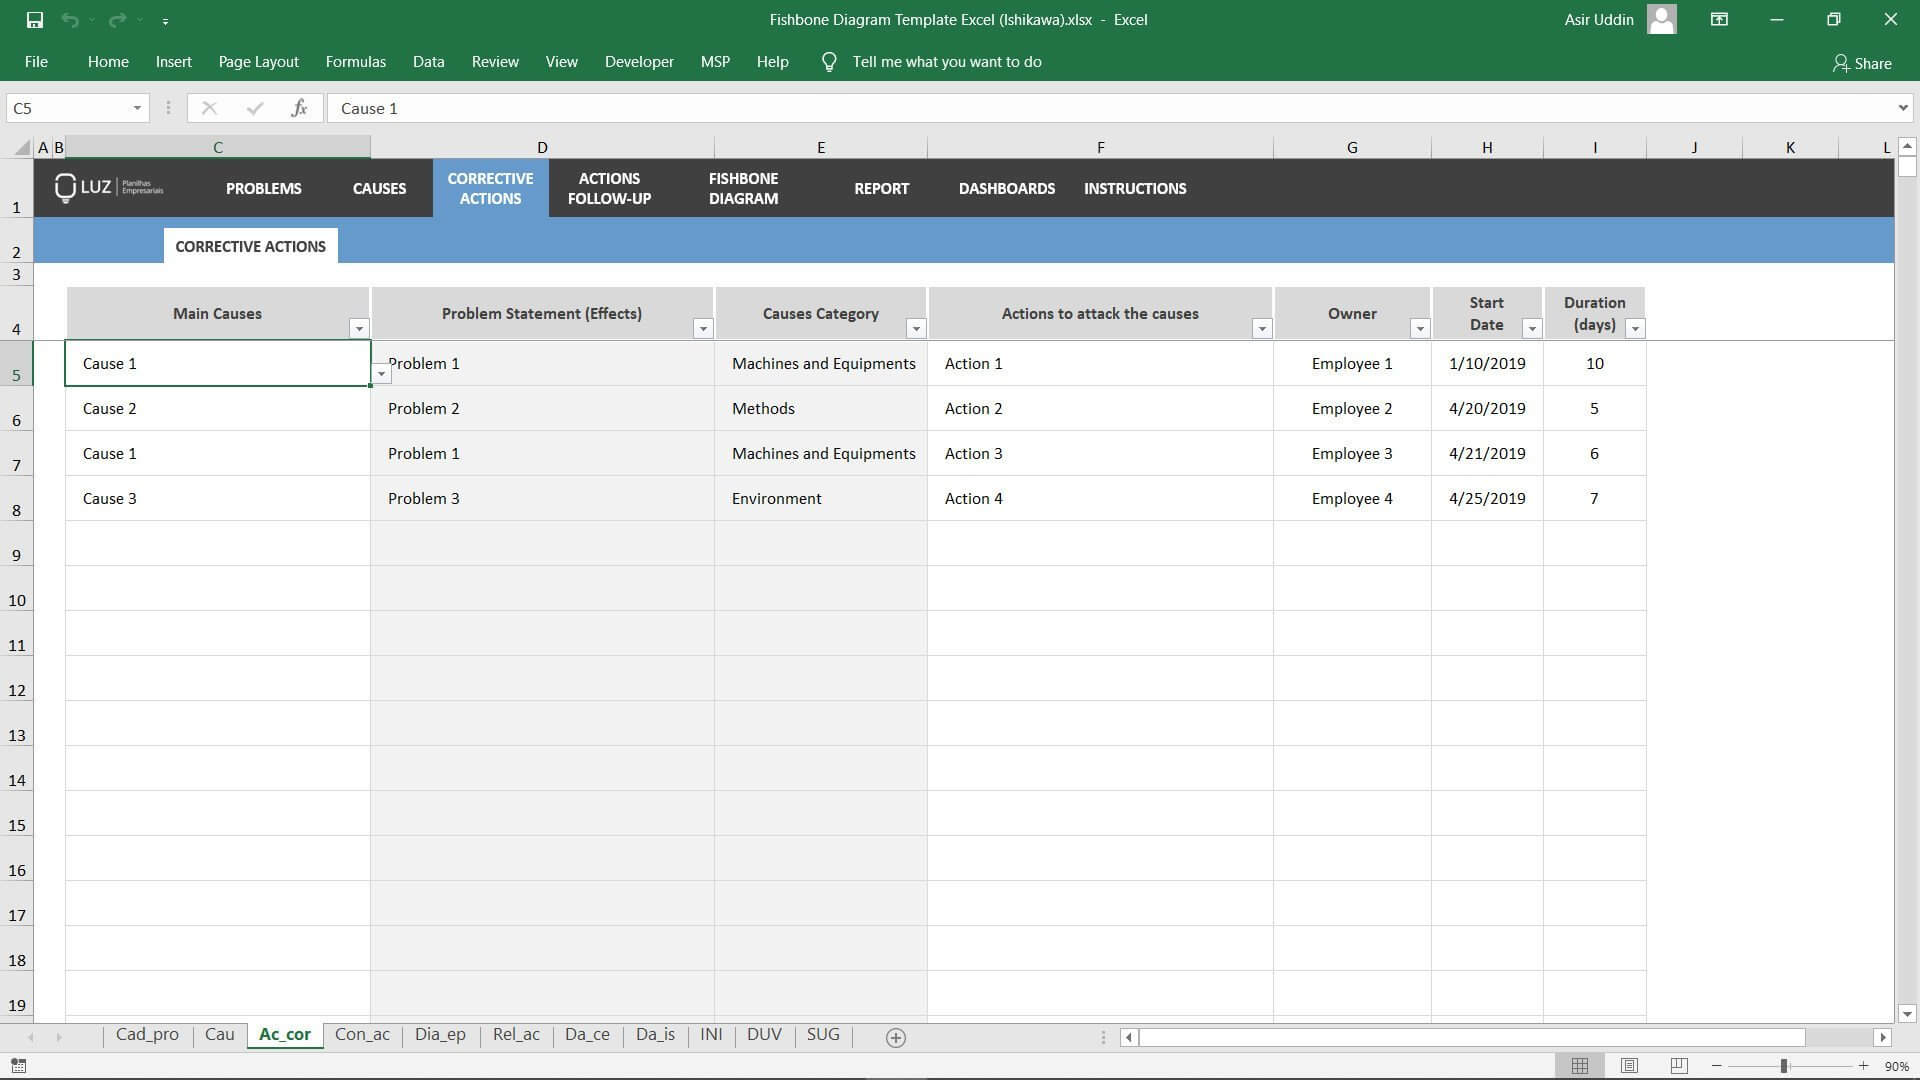
Creating Corrective Actions
Once you get to the cause of your problem, it’s time to set up Action Plans to solve them. In this second part of the Worksheet, it is possible to draw up Action Plans for each of the causes and define responsible and deadline for the realization of these Plans.
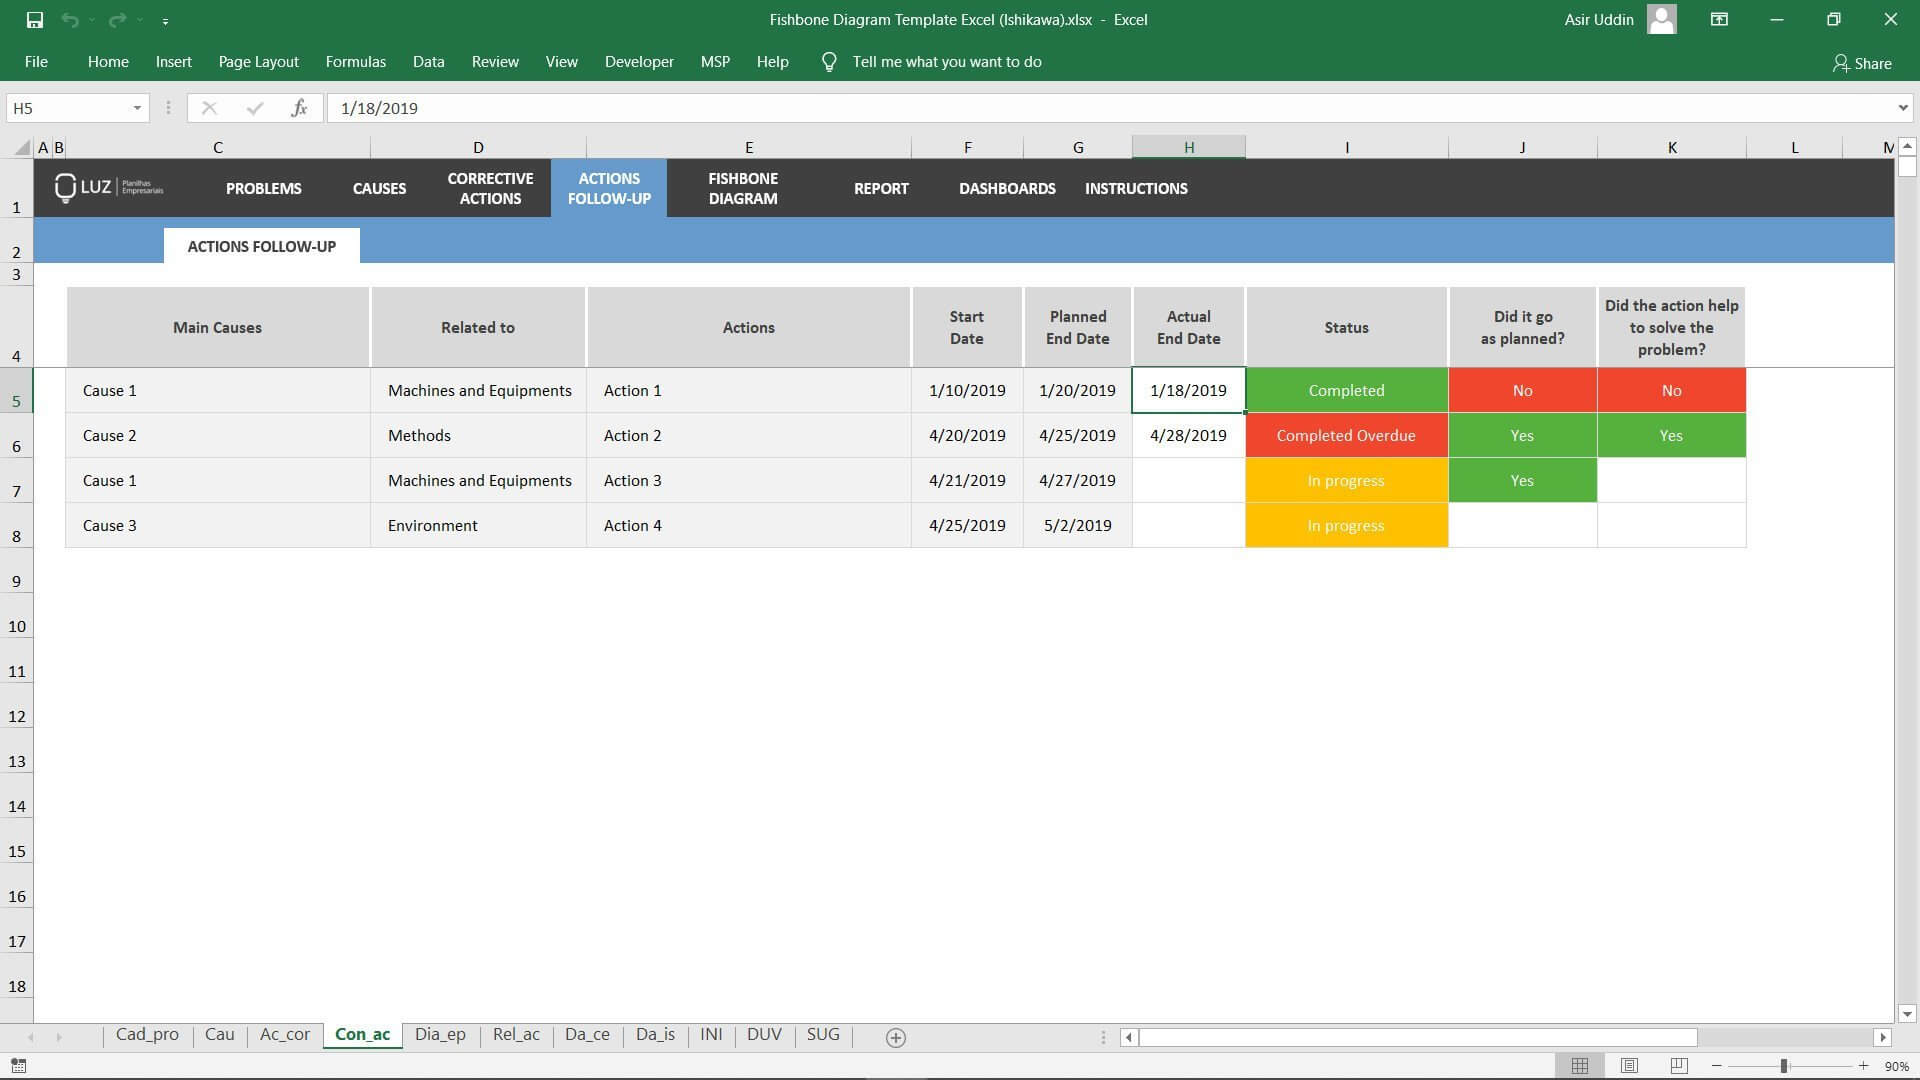
Follow-up of Corrective Actions
After registering your Action Plans it is time to go to the third part of the Worksheet where you will follow up on the execution of these Plans. Here it is important to say whether or not the Resolved Cause had to do with the problem that you are trying to solve.
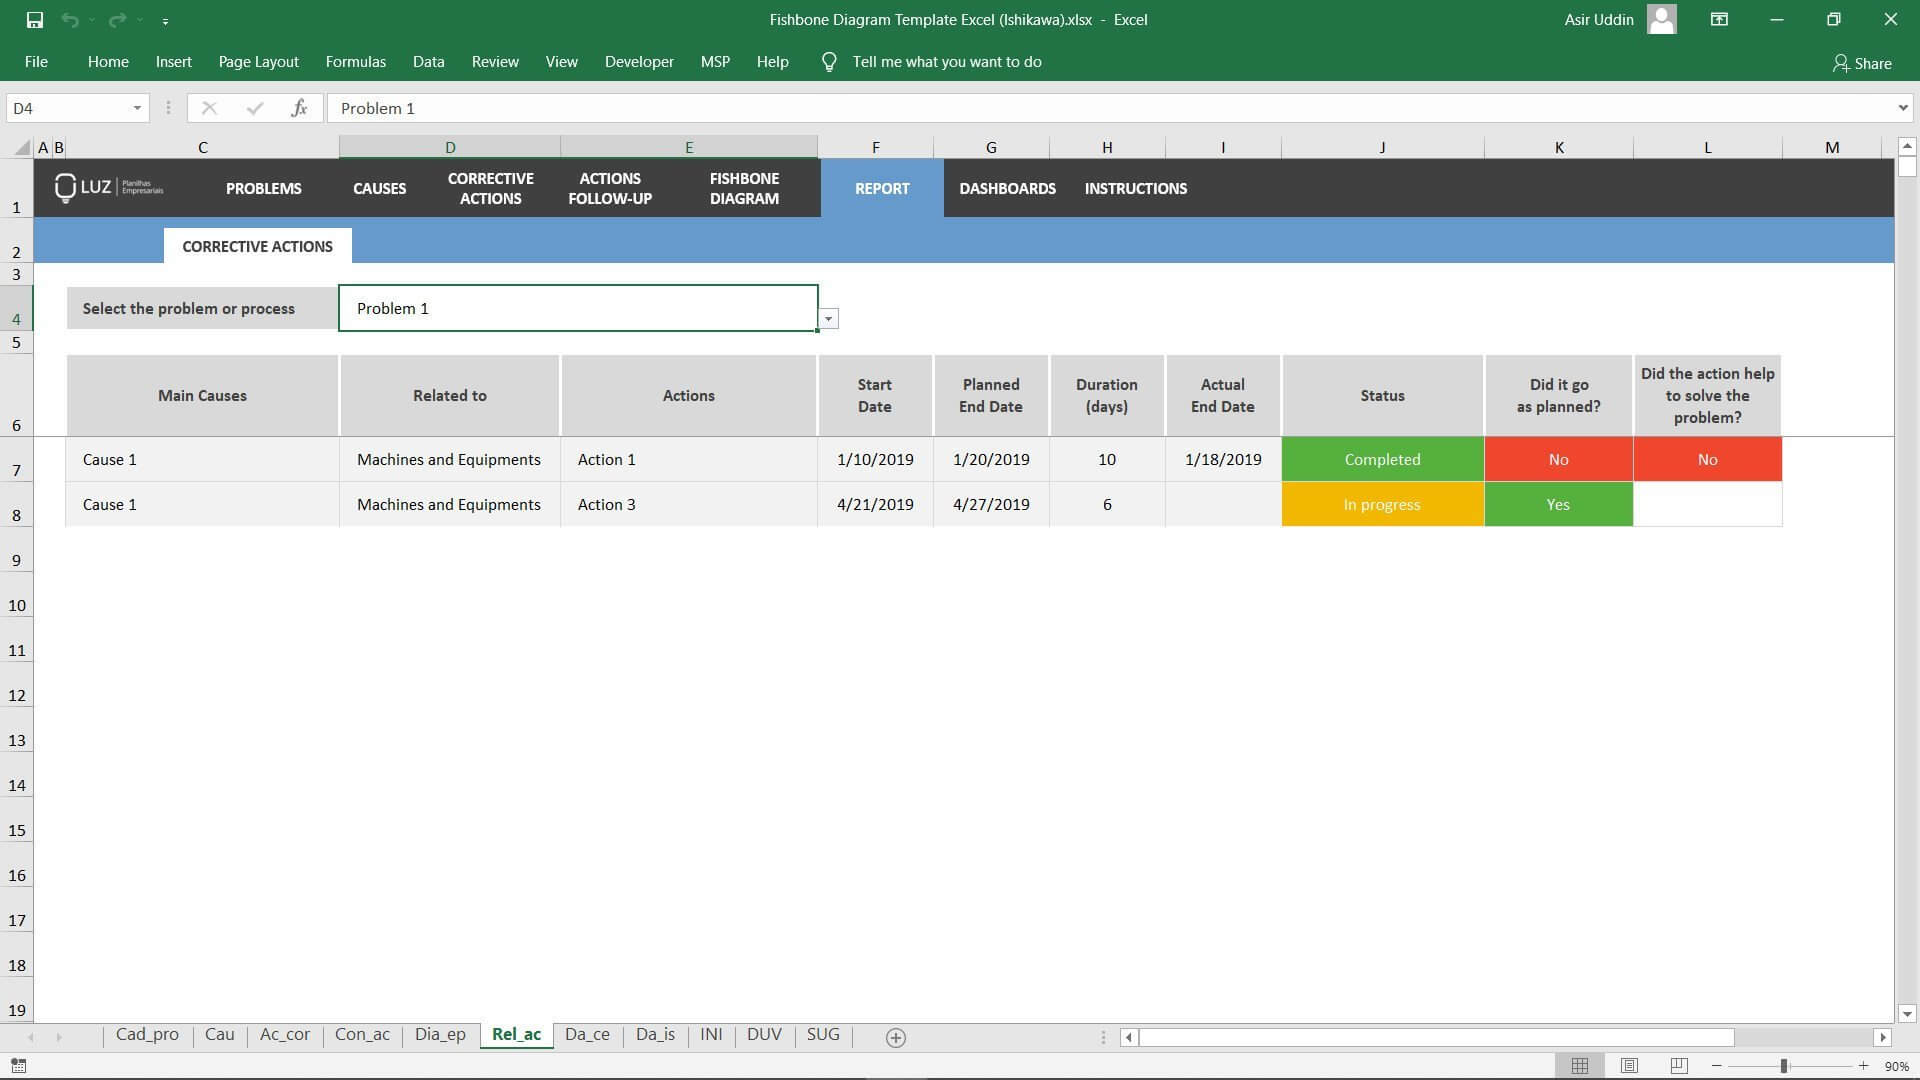
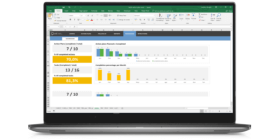
Problem Report
Choose a registered problem and see a report with the progress of all corrective actions related to it.
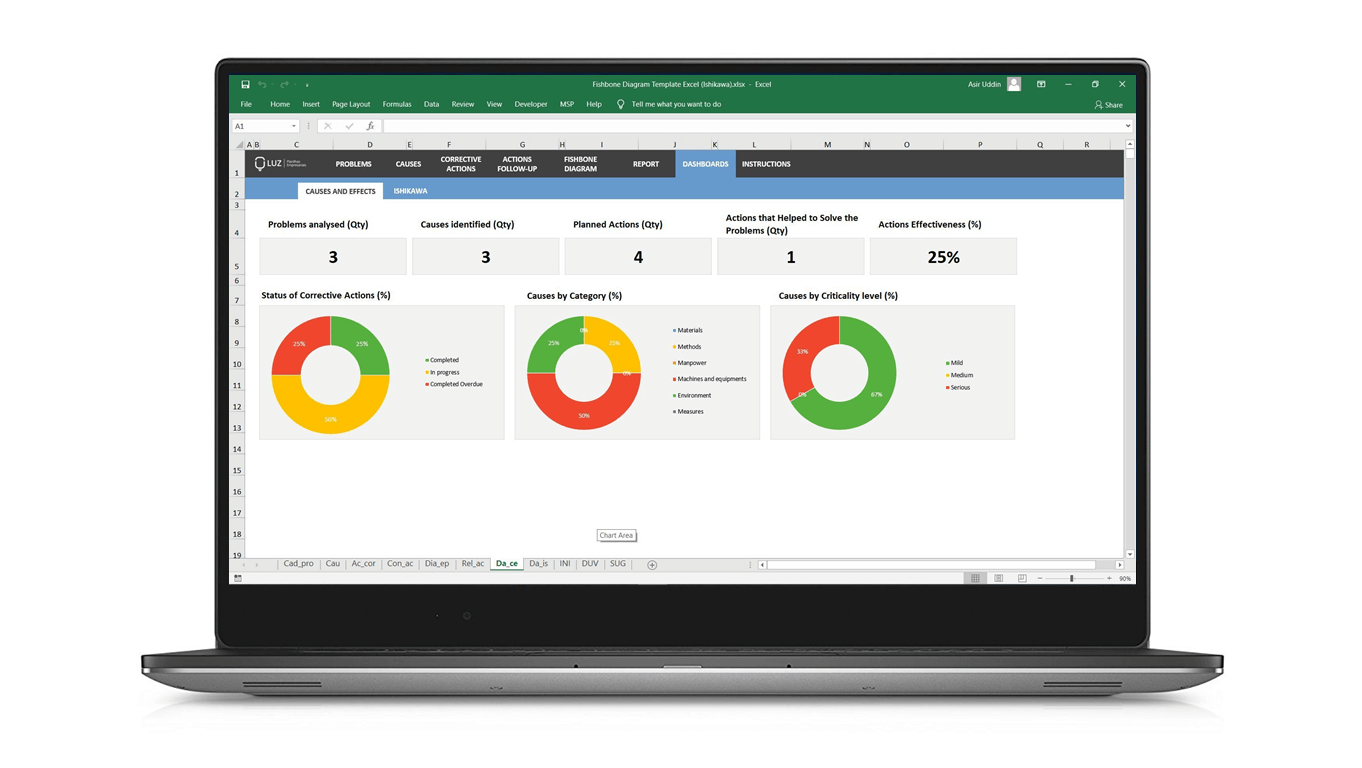
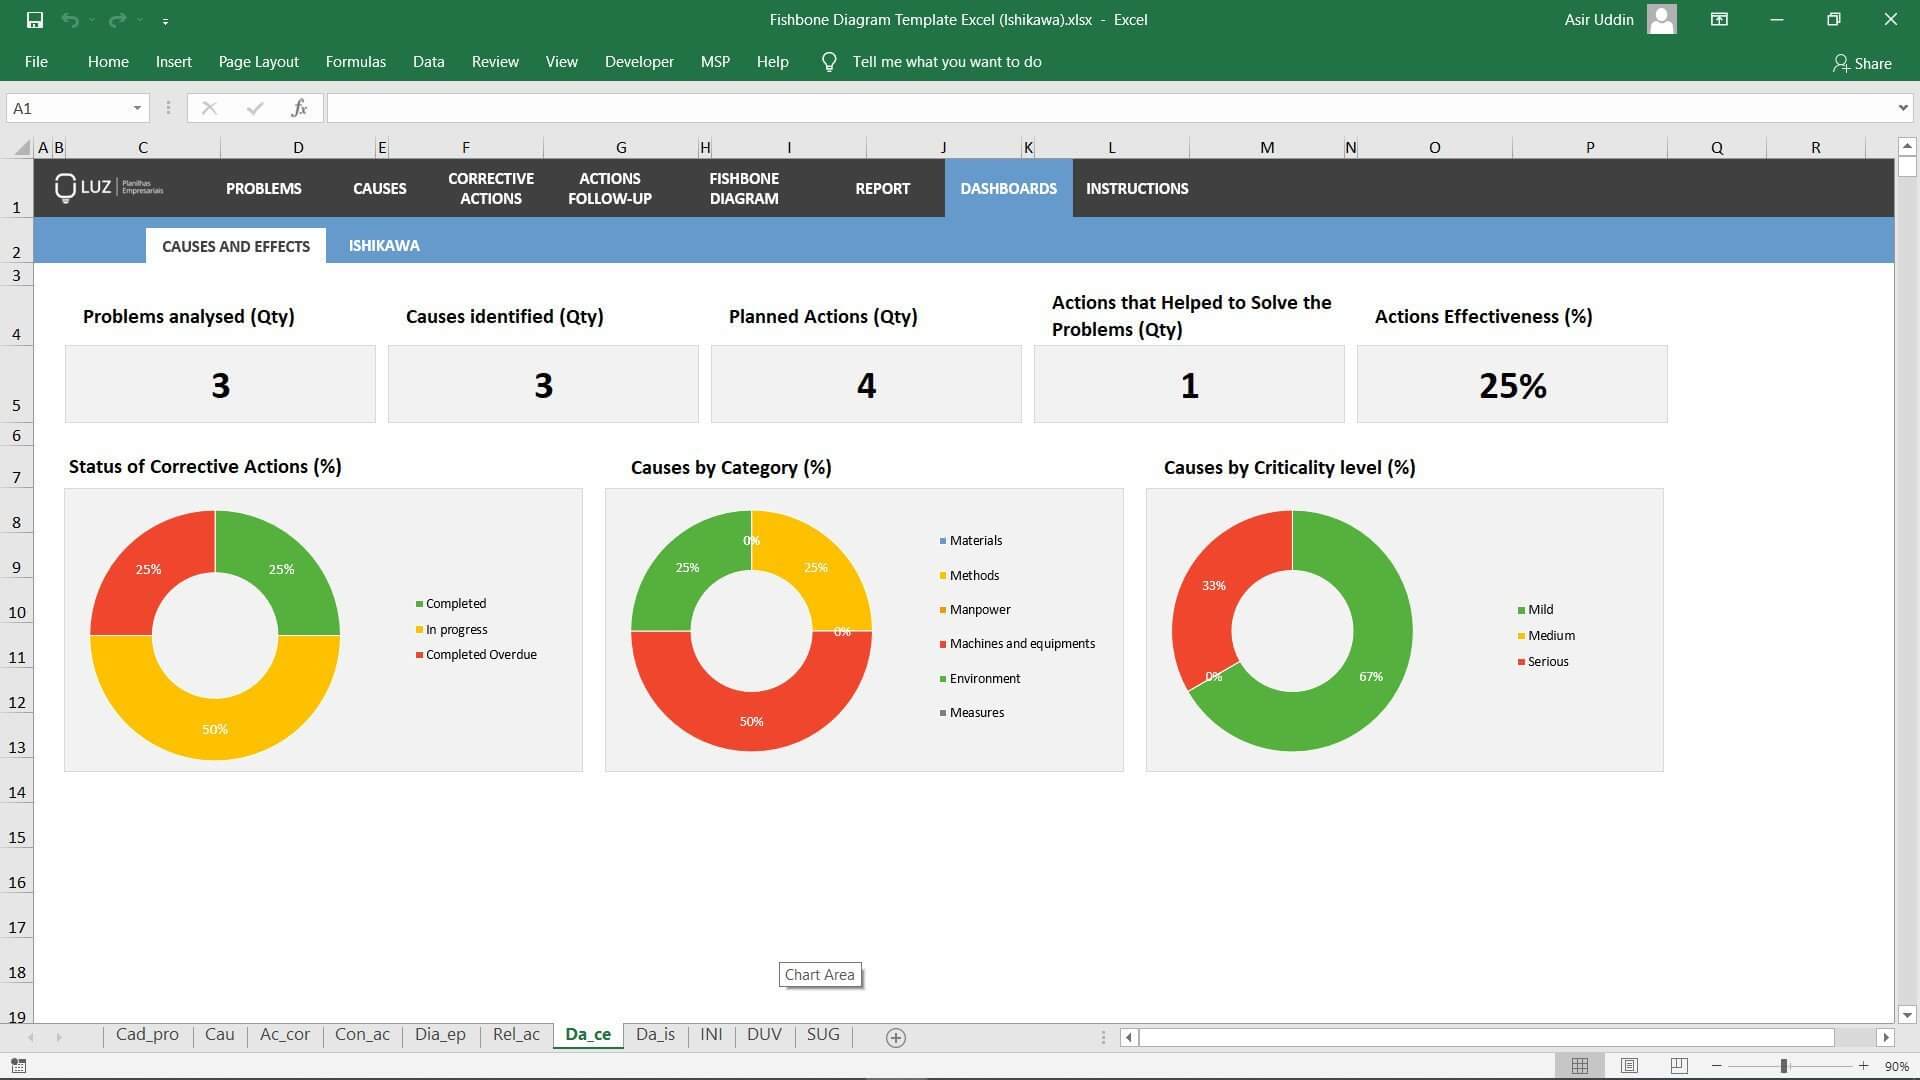
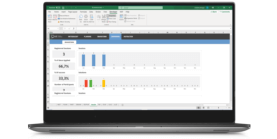
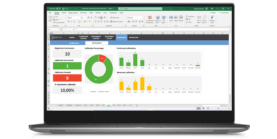
Ishikawa Diagram Dashboard
In this control panel, you will see the number of problems raised, related causes, and corrective actions planned to solve them. You can see graphs indicating the severity of the items raised.
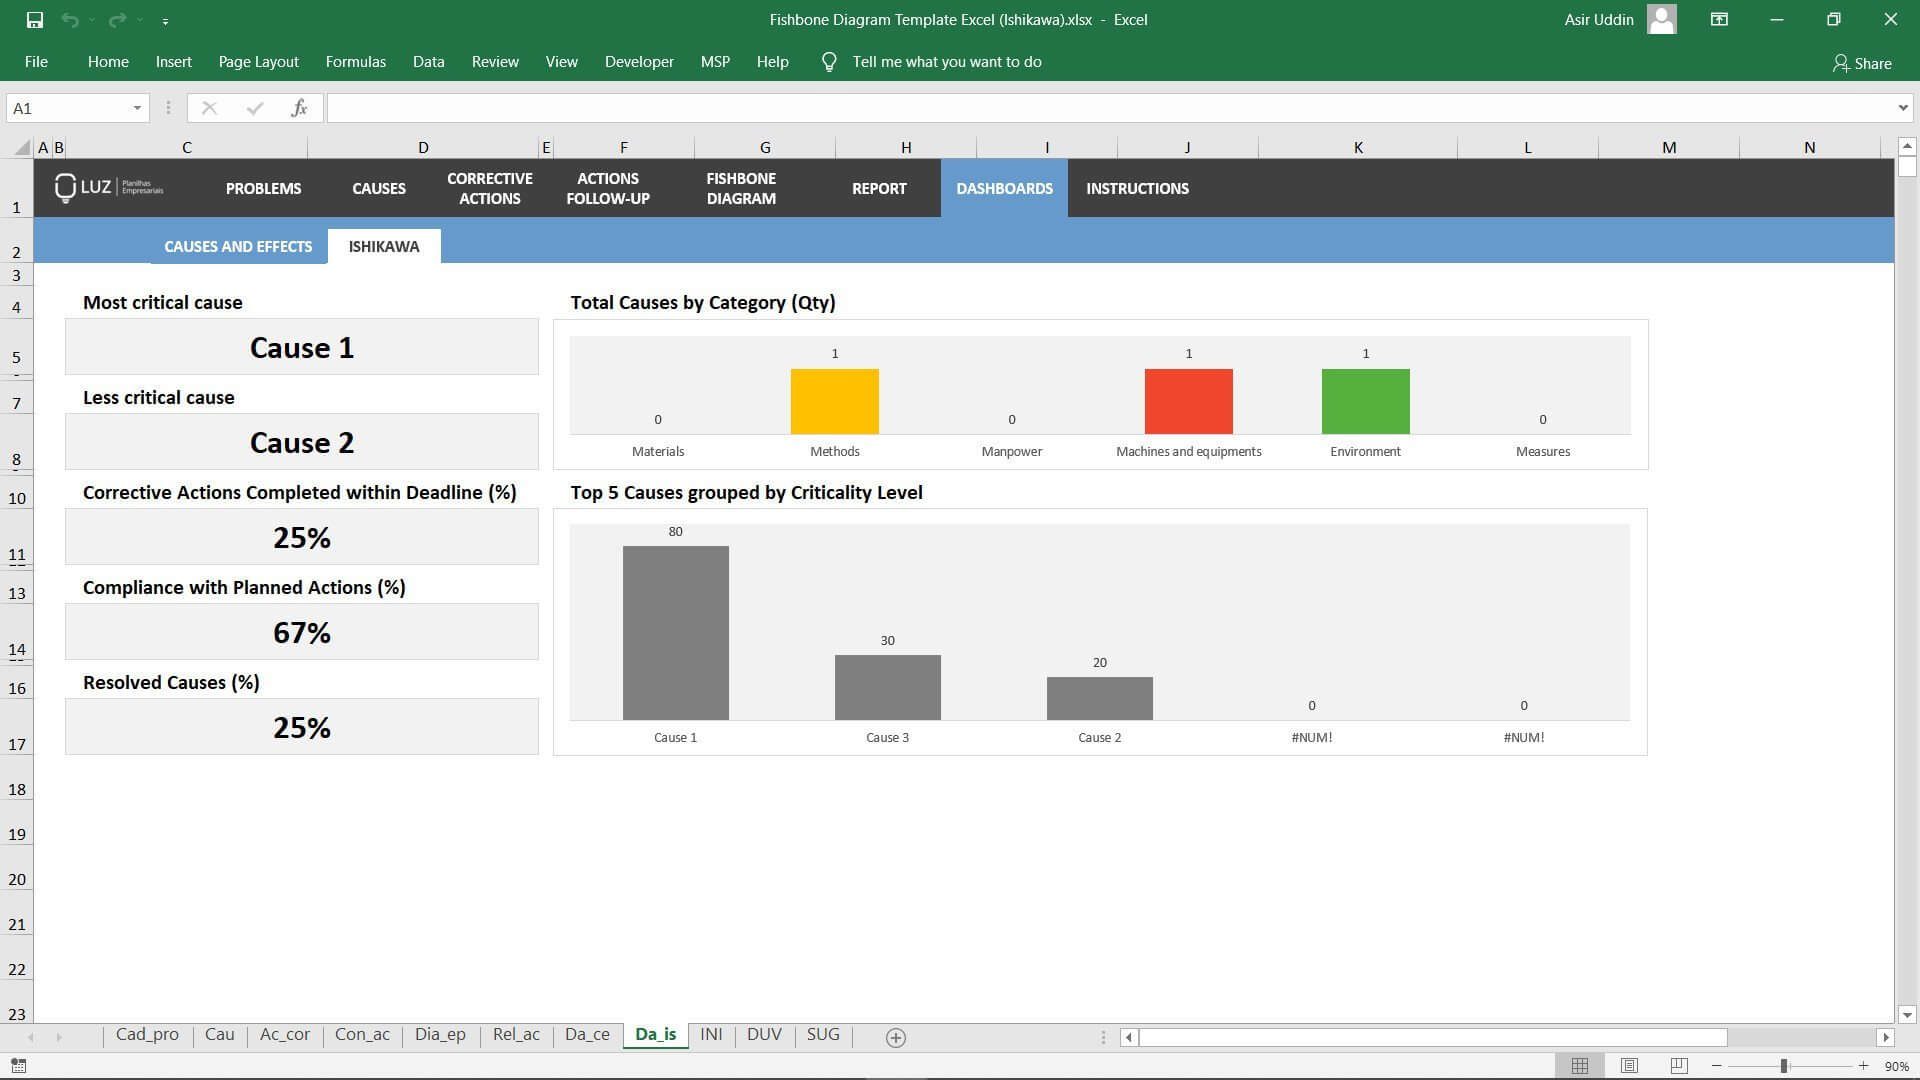
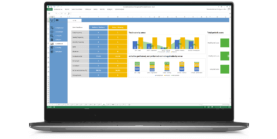
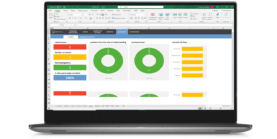
Dashboard with Most Relevant Items
Visualize the causes with higher and lower critical levels, see the completion rates of the actions mapped and analyze a chart with the number of causes by type.
Fishbone Diagram (Ishikawa) Excel Spreadsheet Template