Pareto Chart Excel Spreadsheet Template

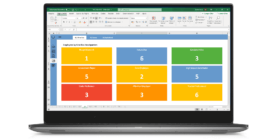
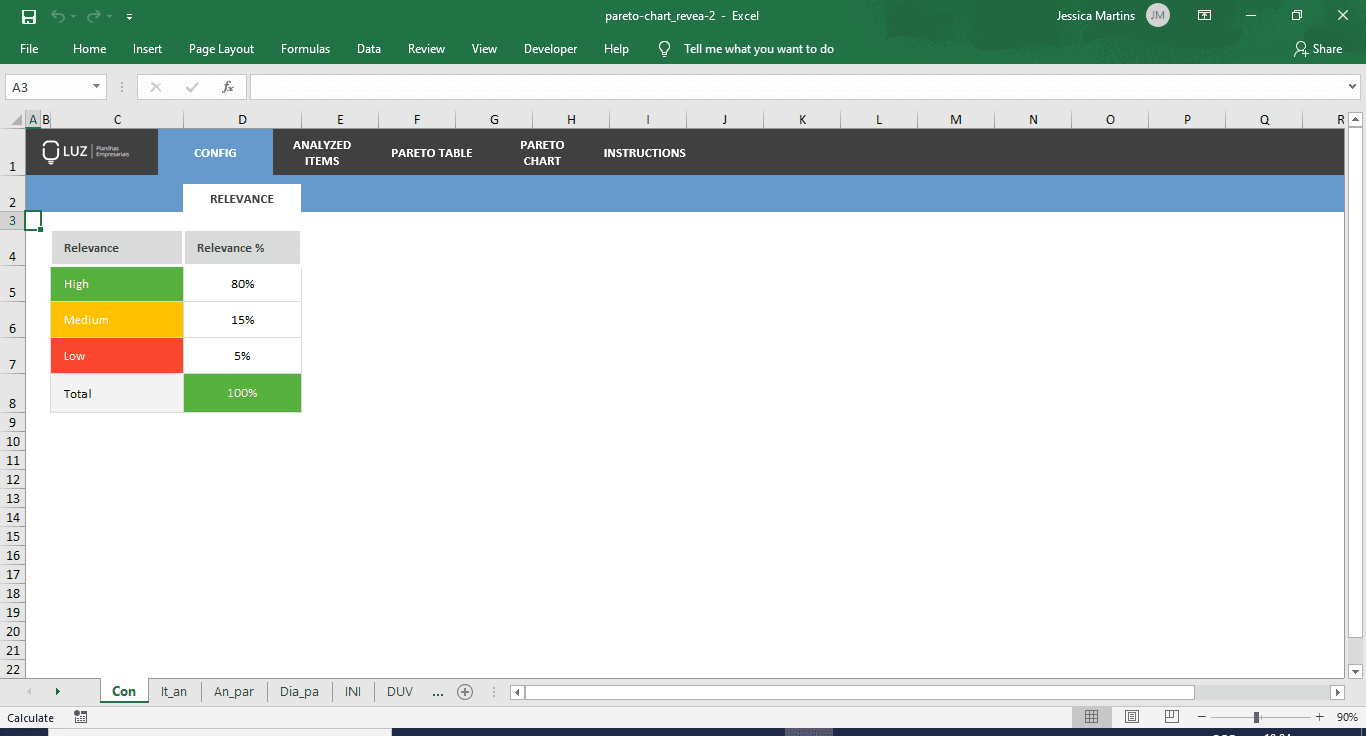
Setting
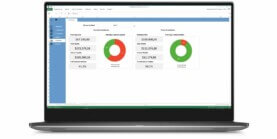
You will set the relevant interval for analysis.

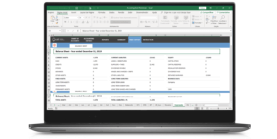
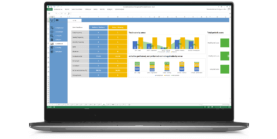
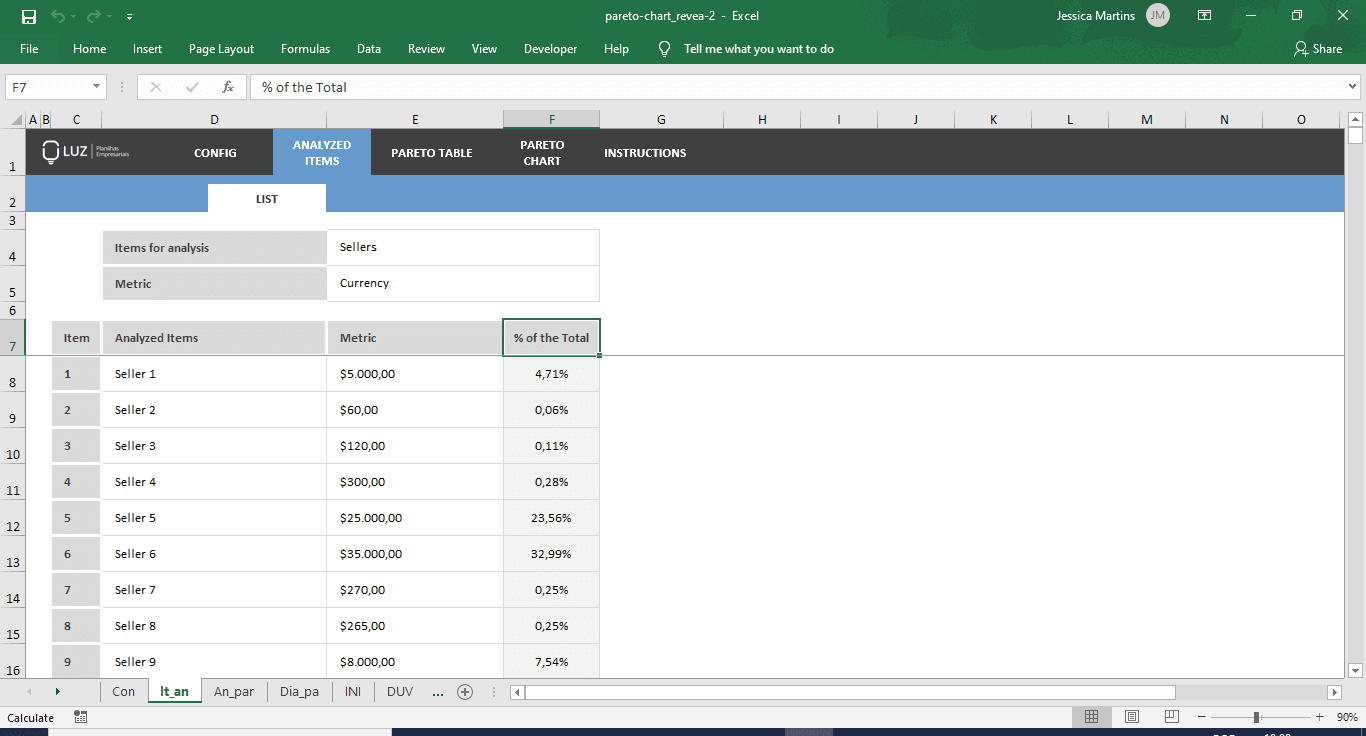
Pareto Analysis of Items for Analysis
The first area of the worksheet allows you to register up to 500 items that will be analyzed according to the Pareto diagram. They can be problems, products, vendors, equipment, or anything that can be measured quantitatively

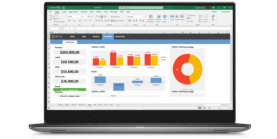
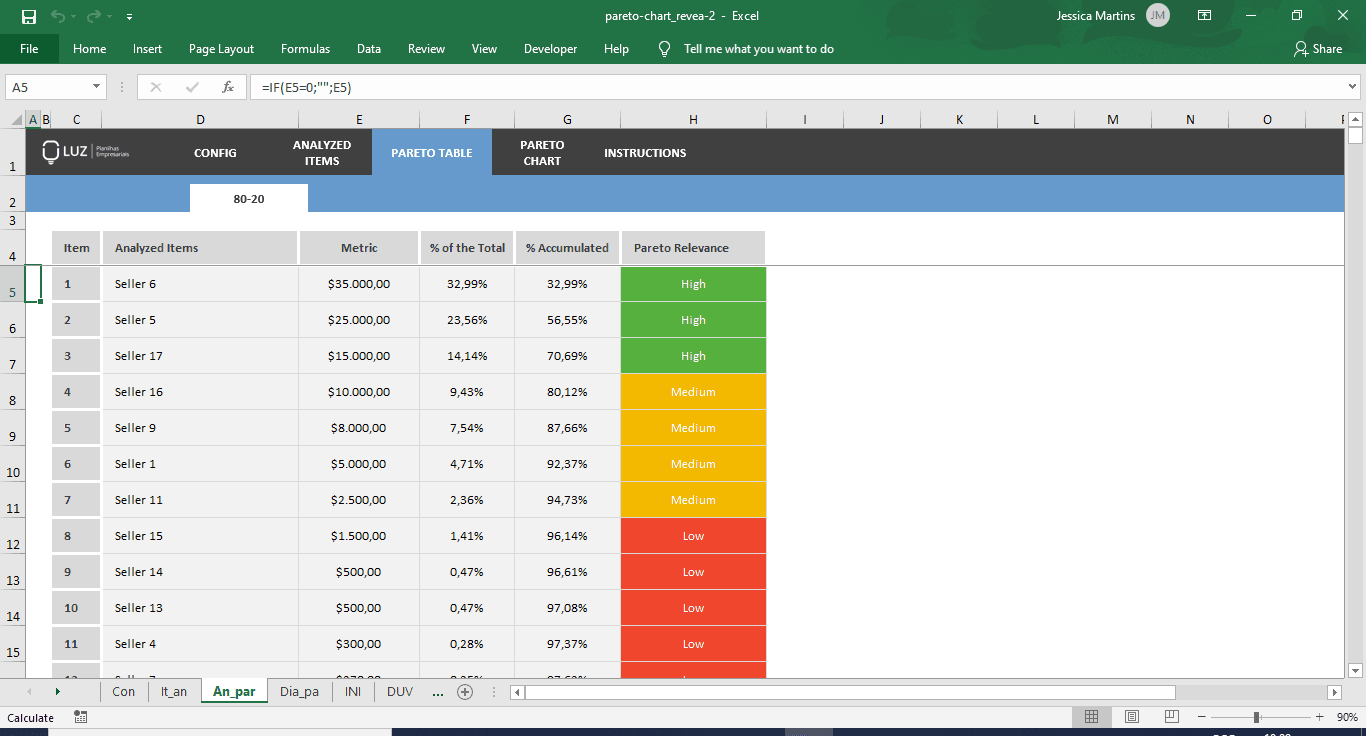
Pareto Analysis (80-20)
Automatically view which items are of high, medium, and low relevance according to the previous tab fill

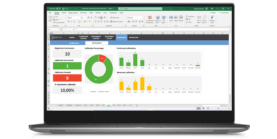
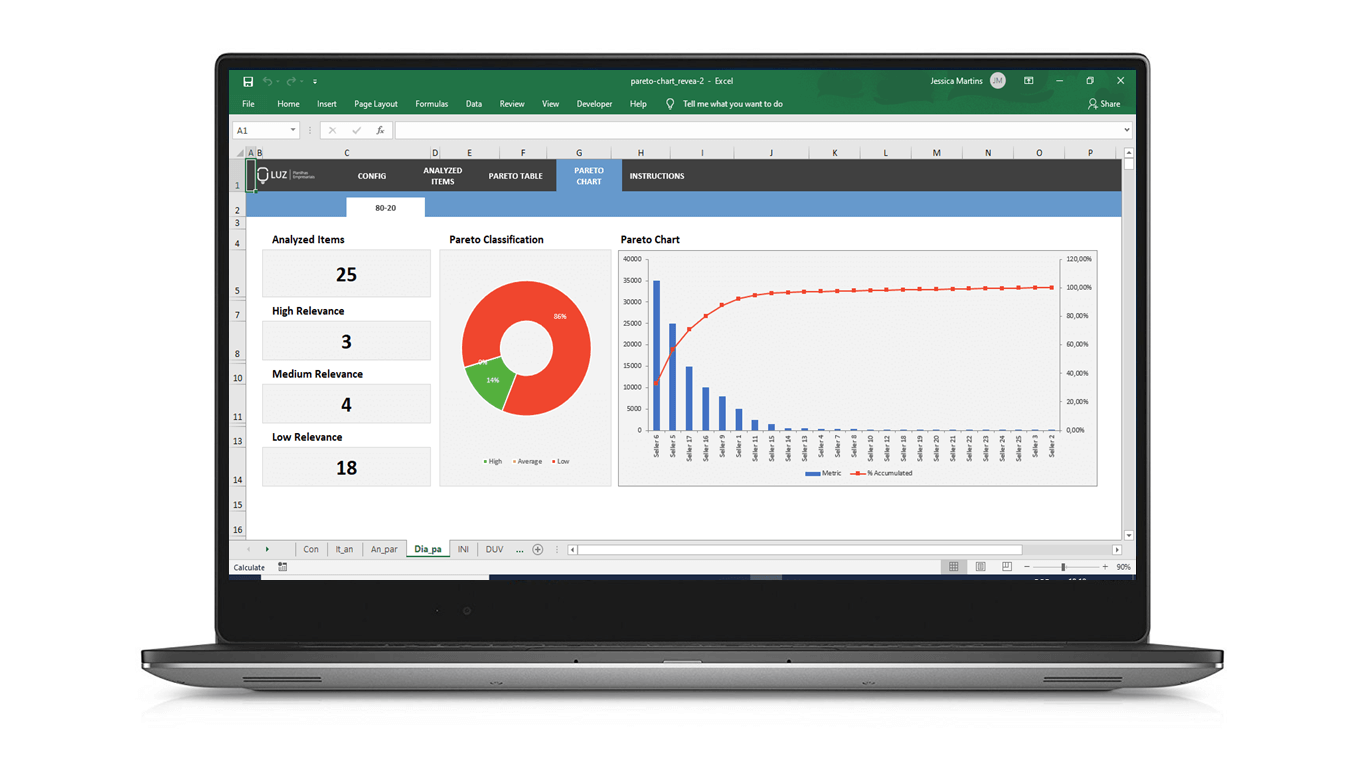
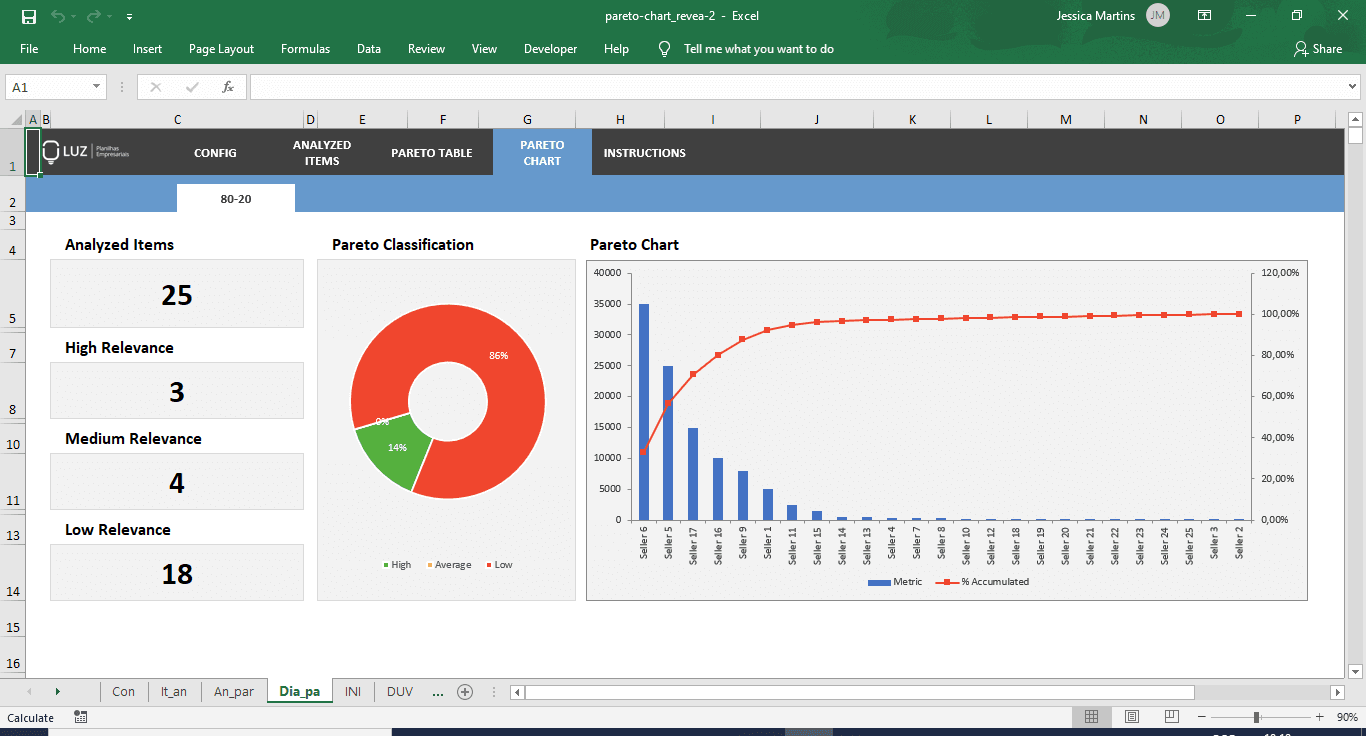
Pareto Diagram Dashboard (80-20)
The spreadsheet still generates a dashboard with the number of items entered and the count of how many are of high, medium, and low relevance. You’ll still see the graph with the Pareto diagram showing the reality of your company’s analysis.

Pareto Chart Excel Spreadsheet Template