Business Financial Management Excel Spreadsheet Template
This Business Financial Management Spreadsheet Template is necessary for any CFO or financial analyst that needs to control and analyze the finance of a business. Easy to use, full of features.
Business Financial Management Spreadsheet Template Features
What’s New in Version 5.0:
- Inserting form to make it easier to add postings
- Possibility of automatic installment
- System release import functionality automatically
- Change in the structure of the account plan allowing up to 20 groups of accounts (up from 11 in total)
- Change in the structure of sub-accounts allowing up to 1500 (up to 1100 with a limit of 100 per account)
- Adjustments for cash and competency accounting with posting, maturity and payment dates
- Auto complete functionality at sub-account launch
- Automatic account posting from posted sub-account reducing fill-in time
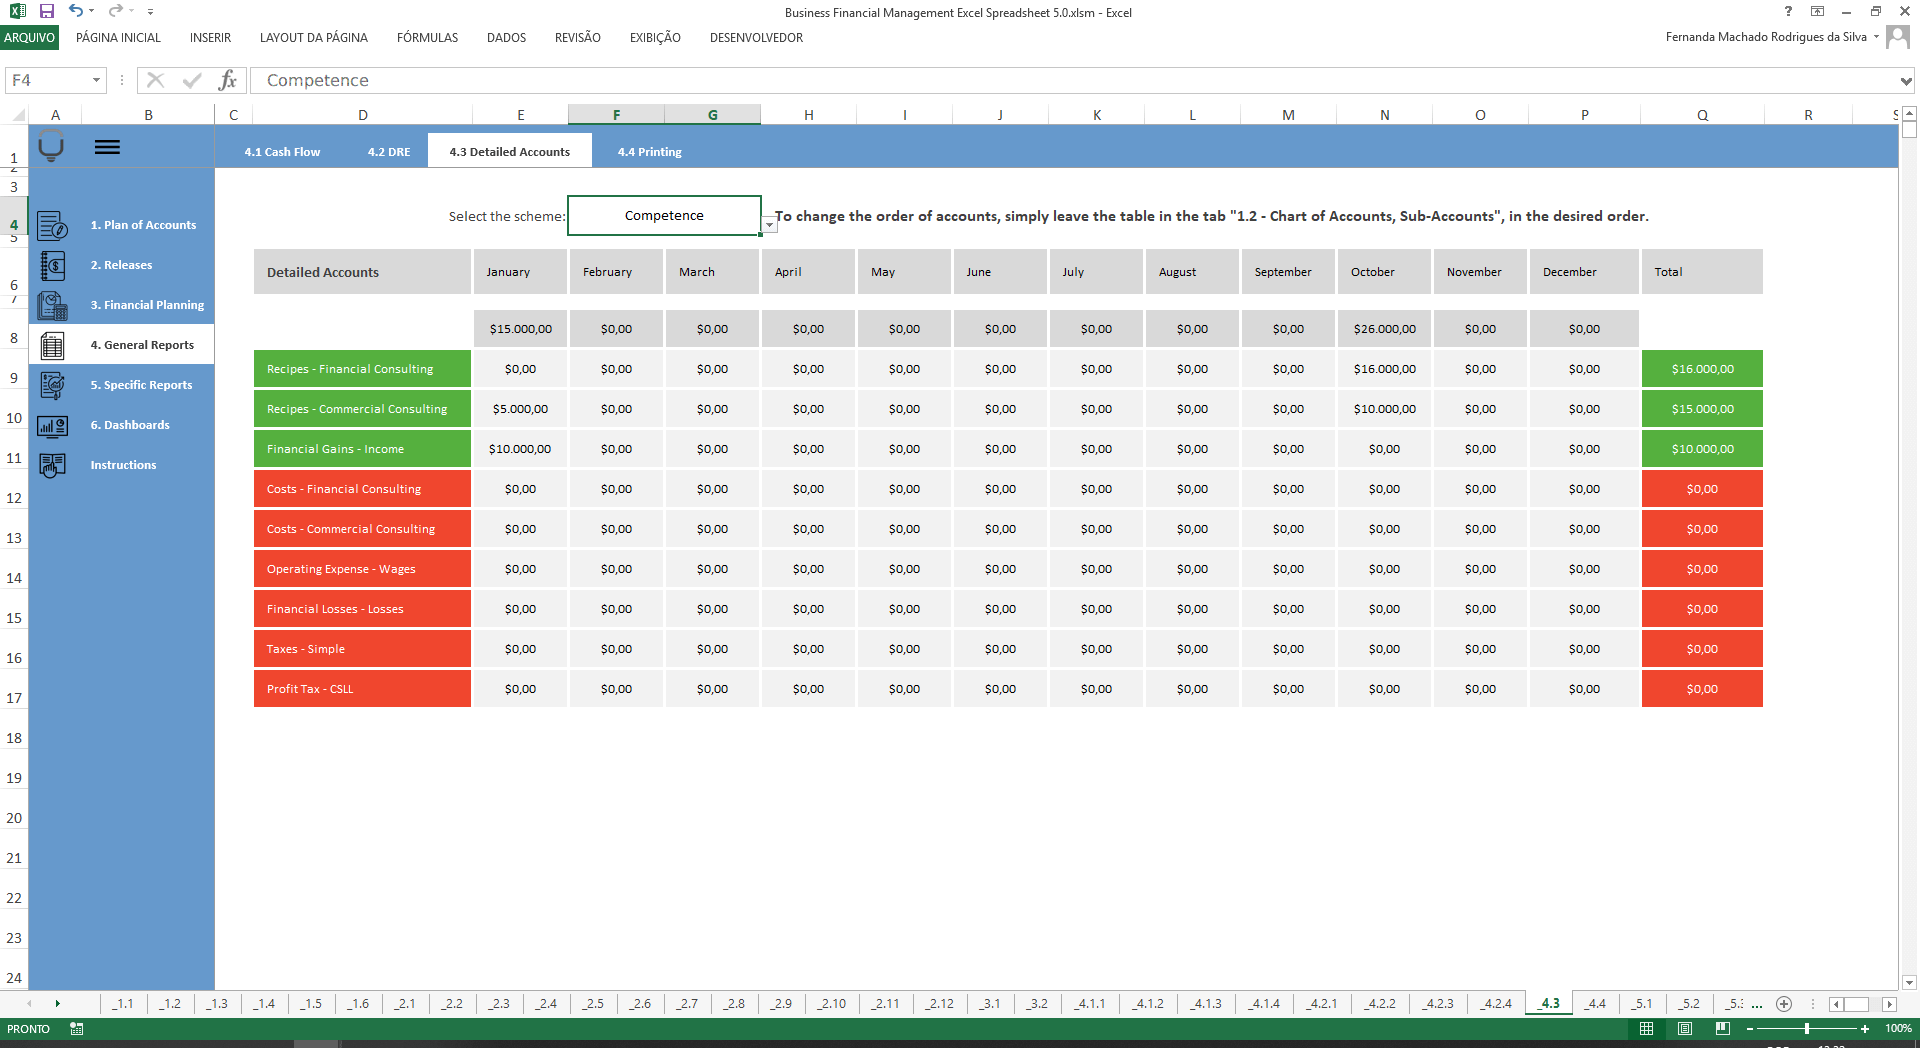
- Analysis of detailed accounts by cash or competency according to choice (previously it was only competence)
- Easy to change the logo on all tabs with just one click
- Quick customization of menu colors and fonts
- New menu layout (hidden or open) improves visualization
- Multi languages
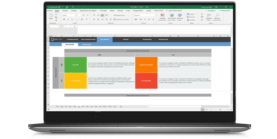
Chart of Accounts
Record the groups of incomes and expenses of your business.
Banks and Forms of Payment
Register the banks you use to have control of your accounts and record the forms of payment you use.
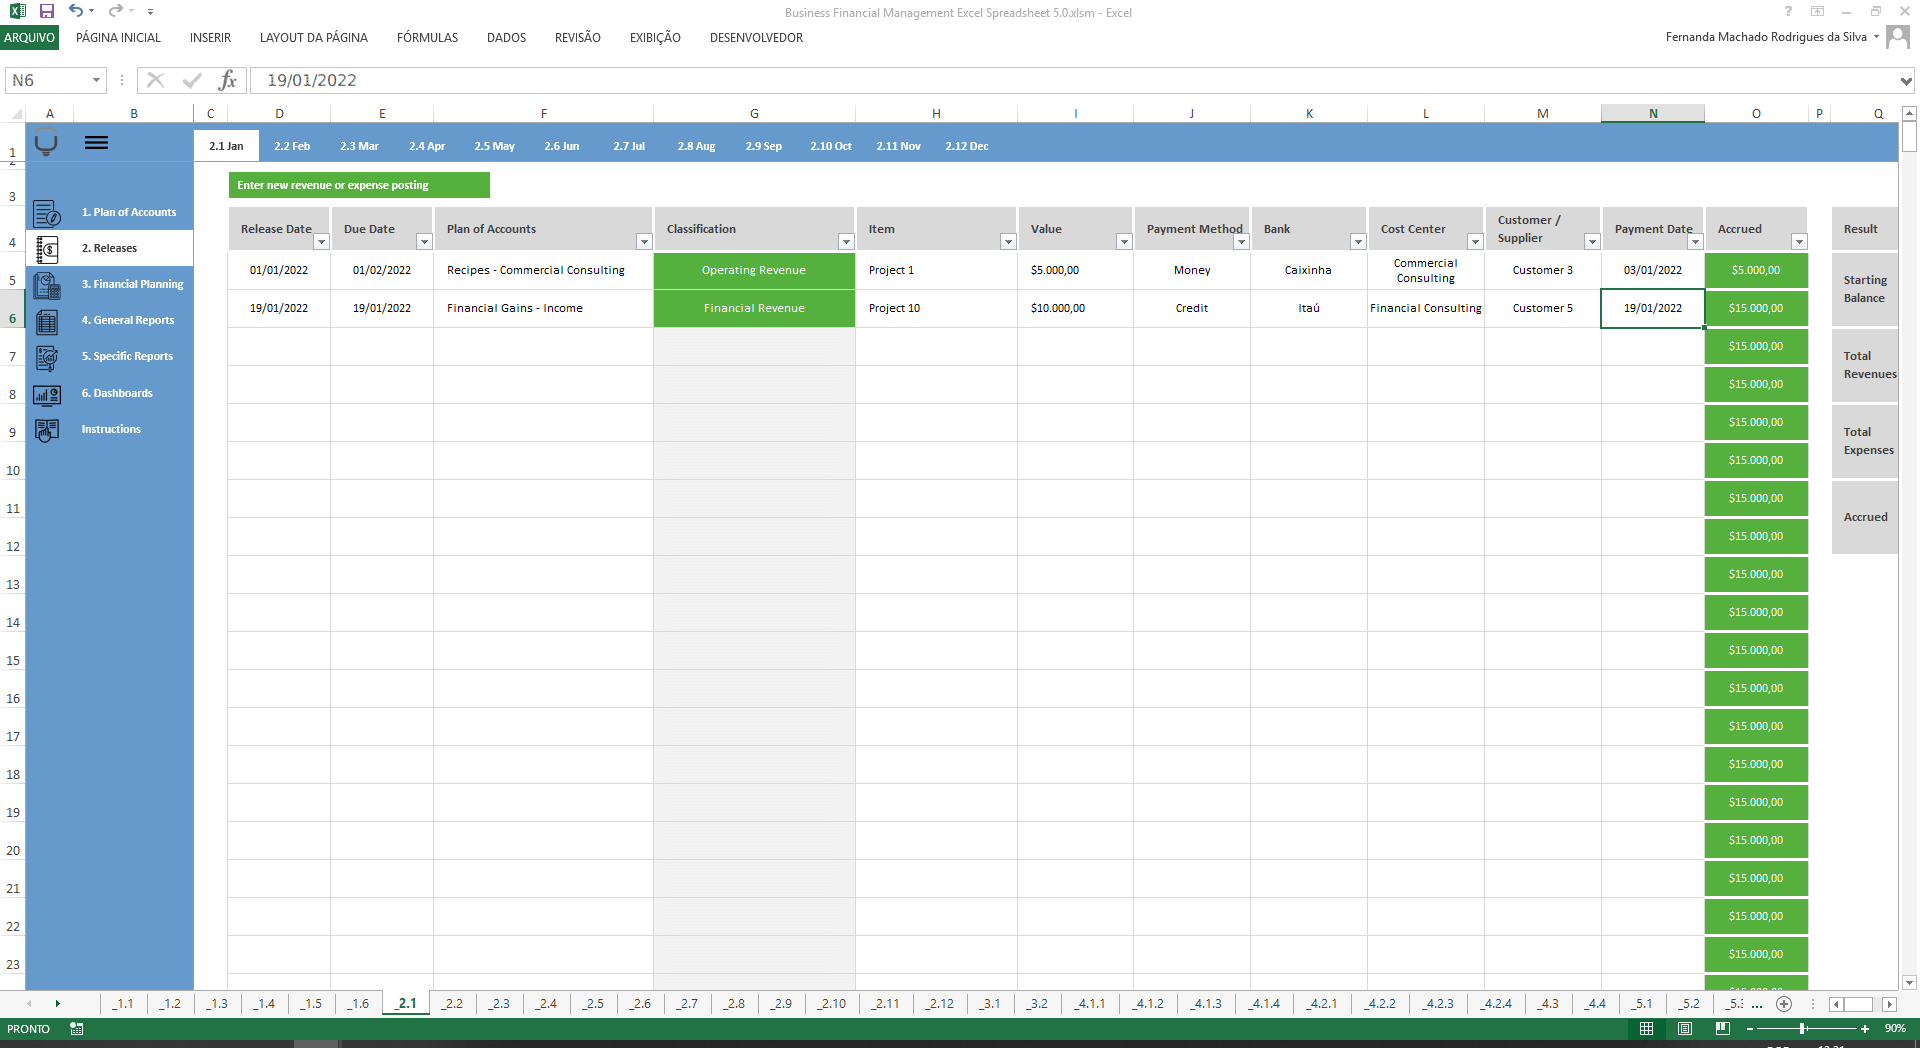
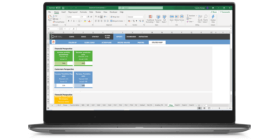
New Releases of Income and Expenses
Ready-to-launch structure with release date selection, chart of accounts, a form of payment, related account, payment status, value, cost center, bank, customer or vendor, and payment date.
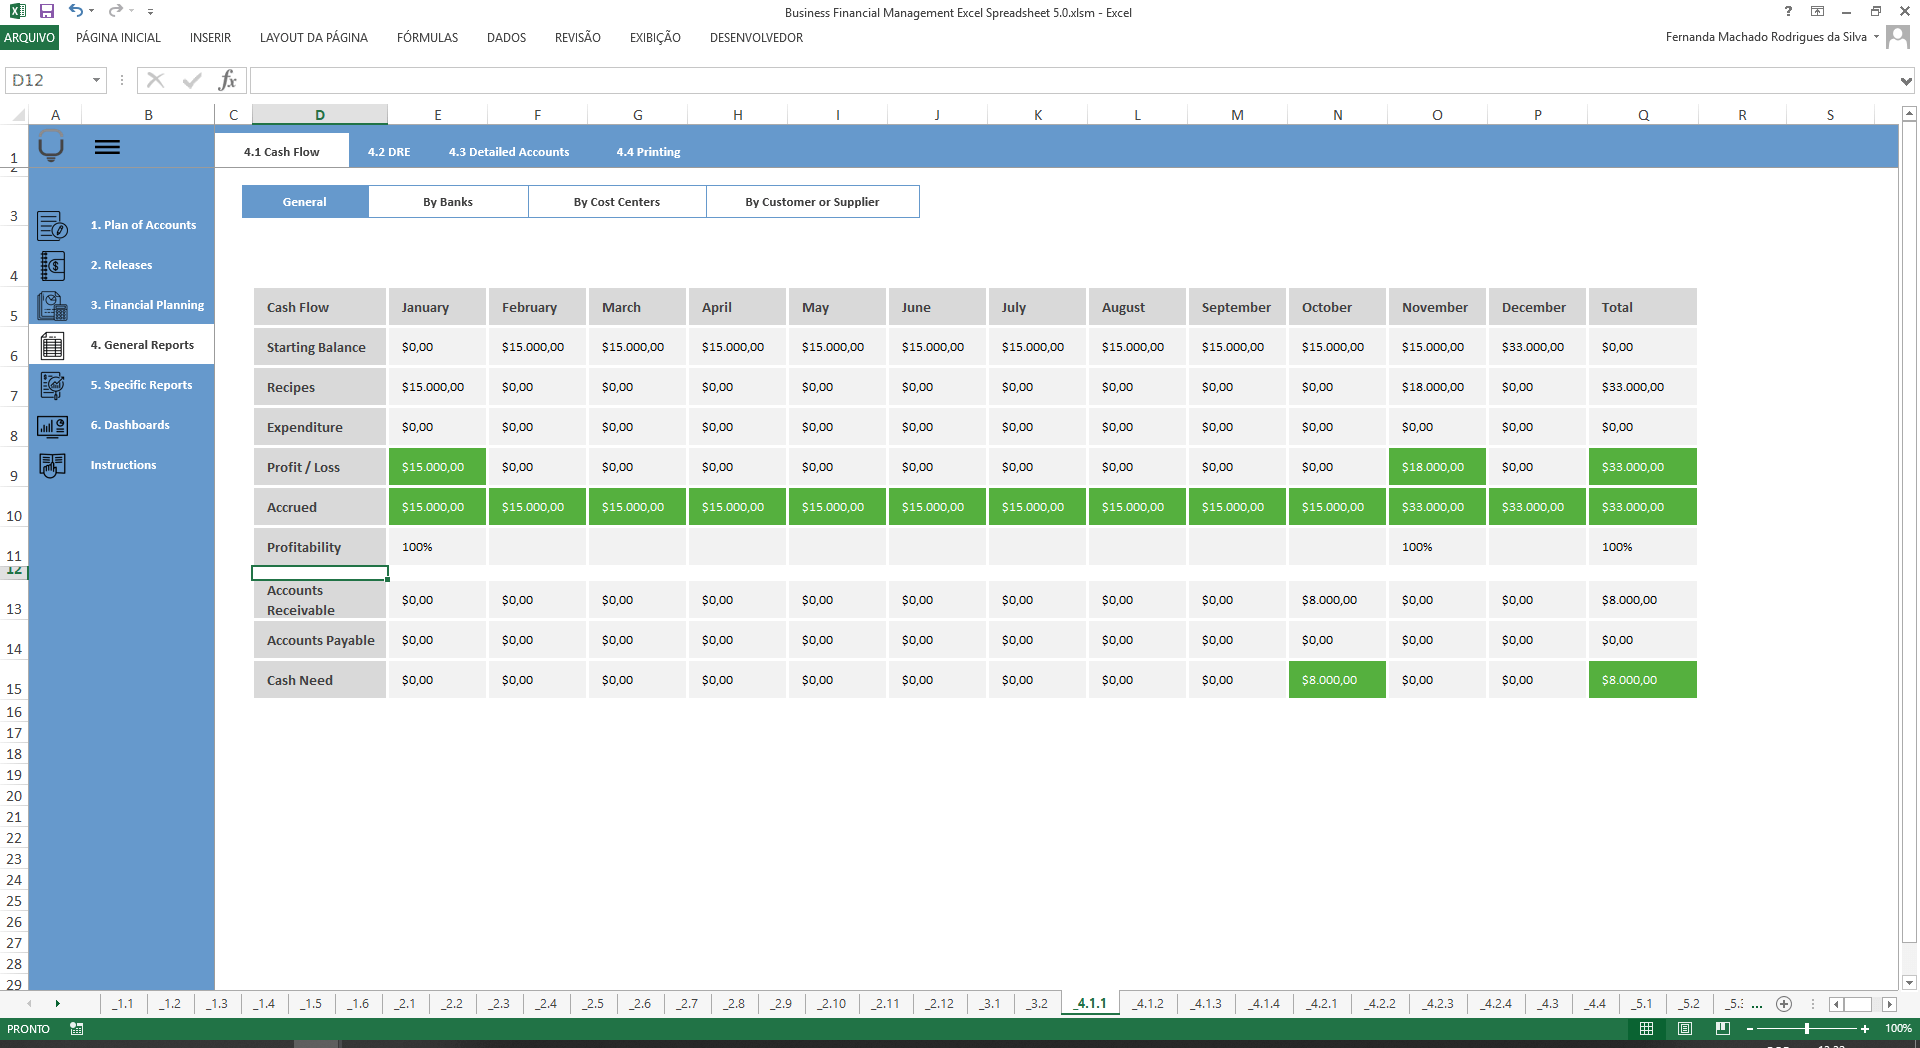
Daily Cash Flow
Select a month and see what is your daily cash flow.
Comparative Analysis among Banks Accounts
Here you analyze a comparative report of the monthly result of entries and exits of all the registered banks.
Statement of Income for the Year – Summary
With Synthetic Statement of Income, you quickly and intuitively see your results from the chart of accounts groups to speed analysis.
Statement of Income for the Year – Summary
See the results of your Income Statement for all sub-accounts registered in a specific account.
Bills to pay and receive
Track your accounts payable and receivable, check customer defaults, and if cash is needed for future months.
Specific Cash Flows
You can see the specific cash flows by cost center, bank, and customer or vendor to make specific analyzes and make quick decisions.
Specific DREs
You will see specific DREs per cost center, per account, and per customer or vendor. Then you can measure the results in detail.
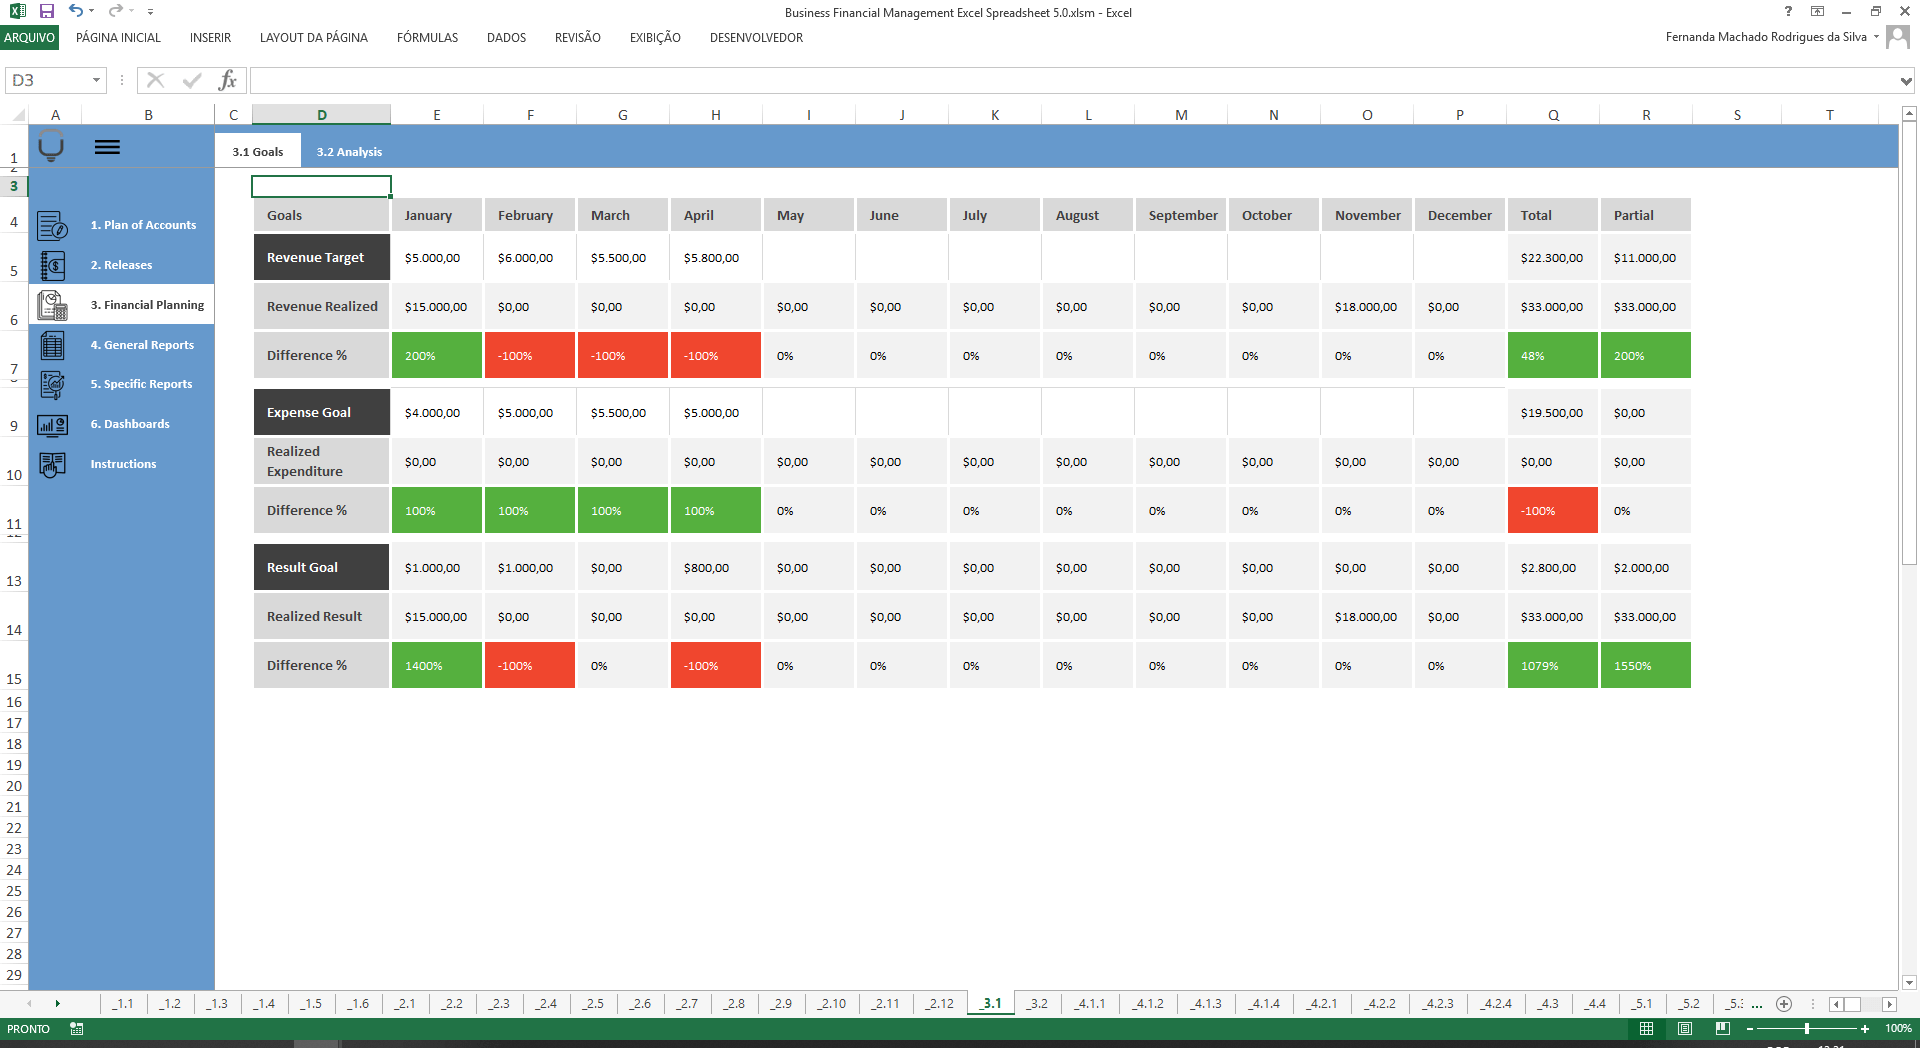
Definition of Goals
Make projections of income and expenses for future months and compare what you actually did in the goal report.
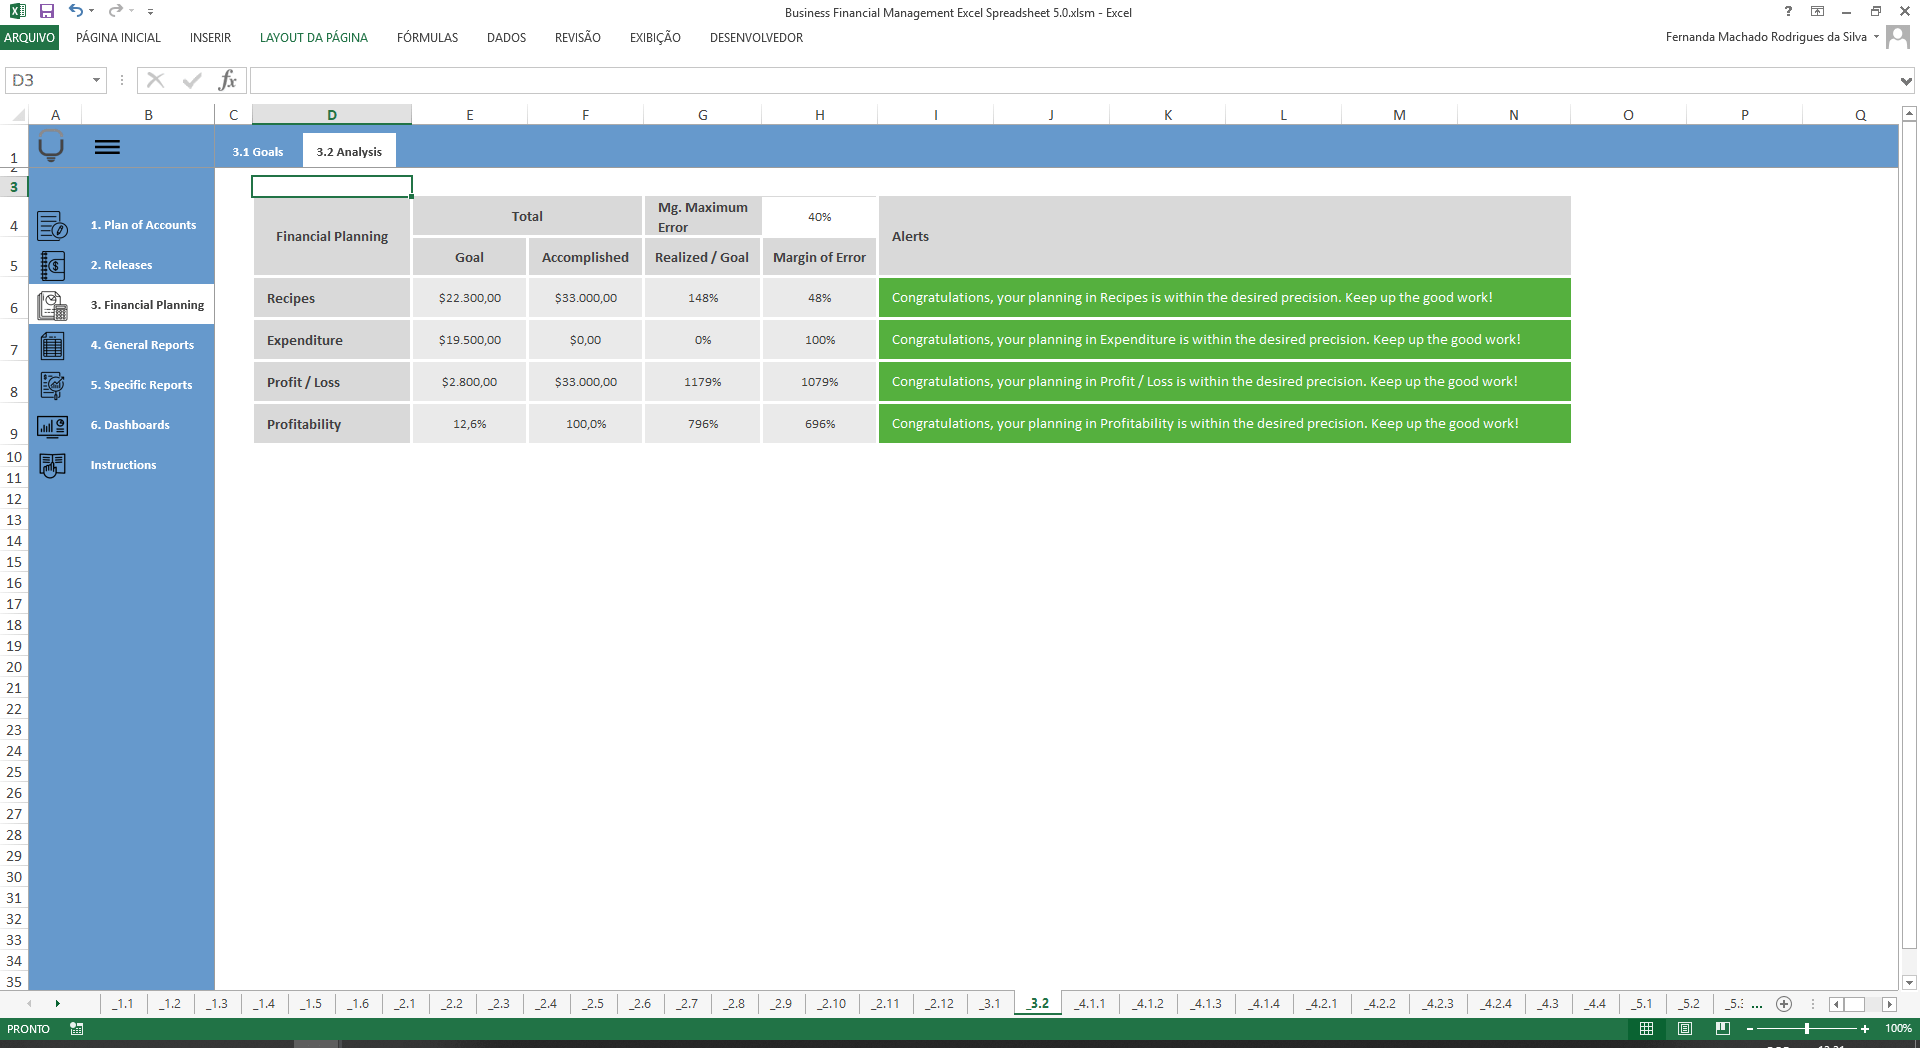
Financial Planning Analysis
Based on your results and what you have planned, the worksheet gives you a degree of assertiveness of your financial projection, indicating a margin of error and items with more or less than 90% proximity to your plan.
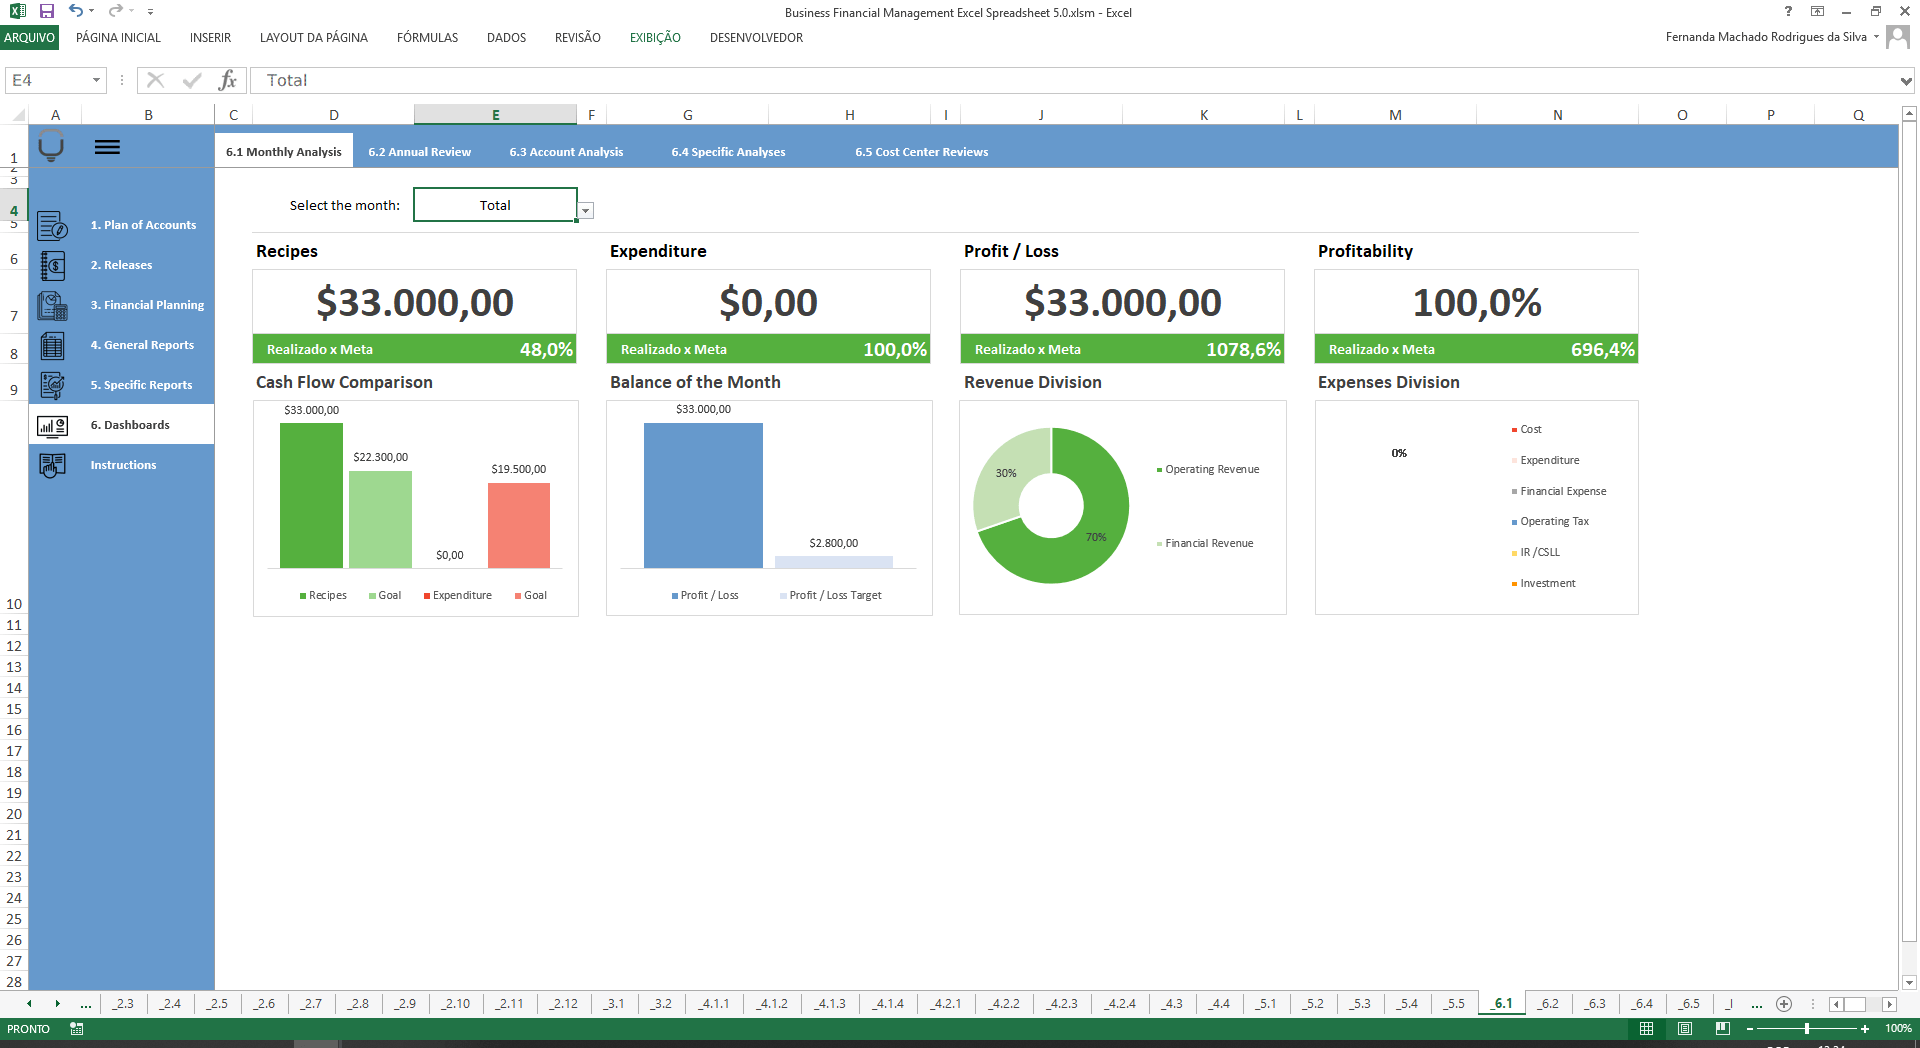
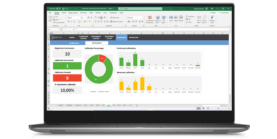
Monthly Financial Analysis Dashboard
The key financial metrics of your company are automatically created in this dashboard and allow you to track your results visually and easily.
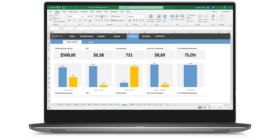
Annual Review Dashboard
See the main annual indicators of your business and follow the graphs of incomes x expenses and the graph of accounts receivable x accounts payable.
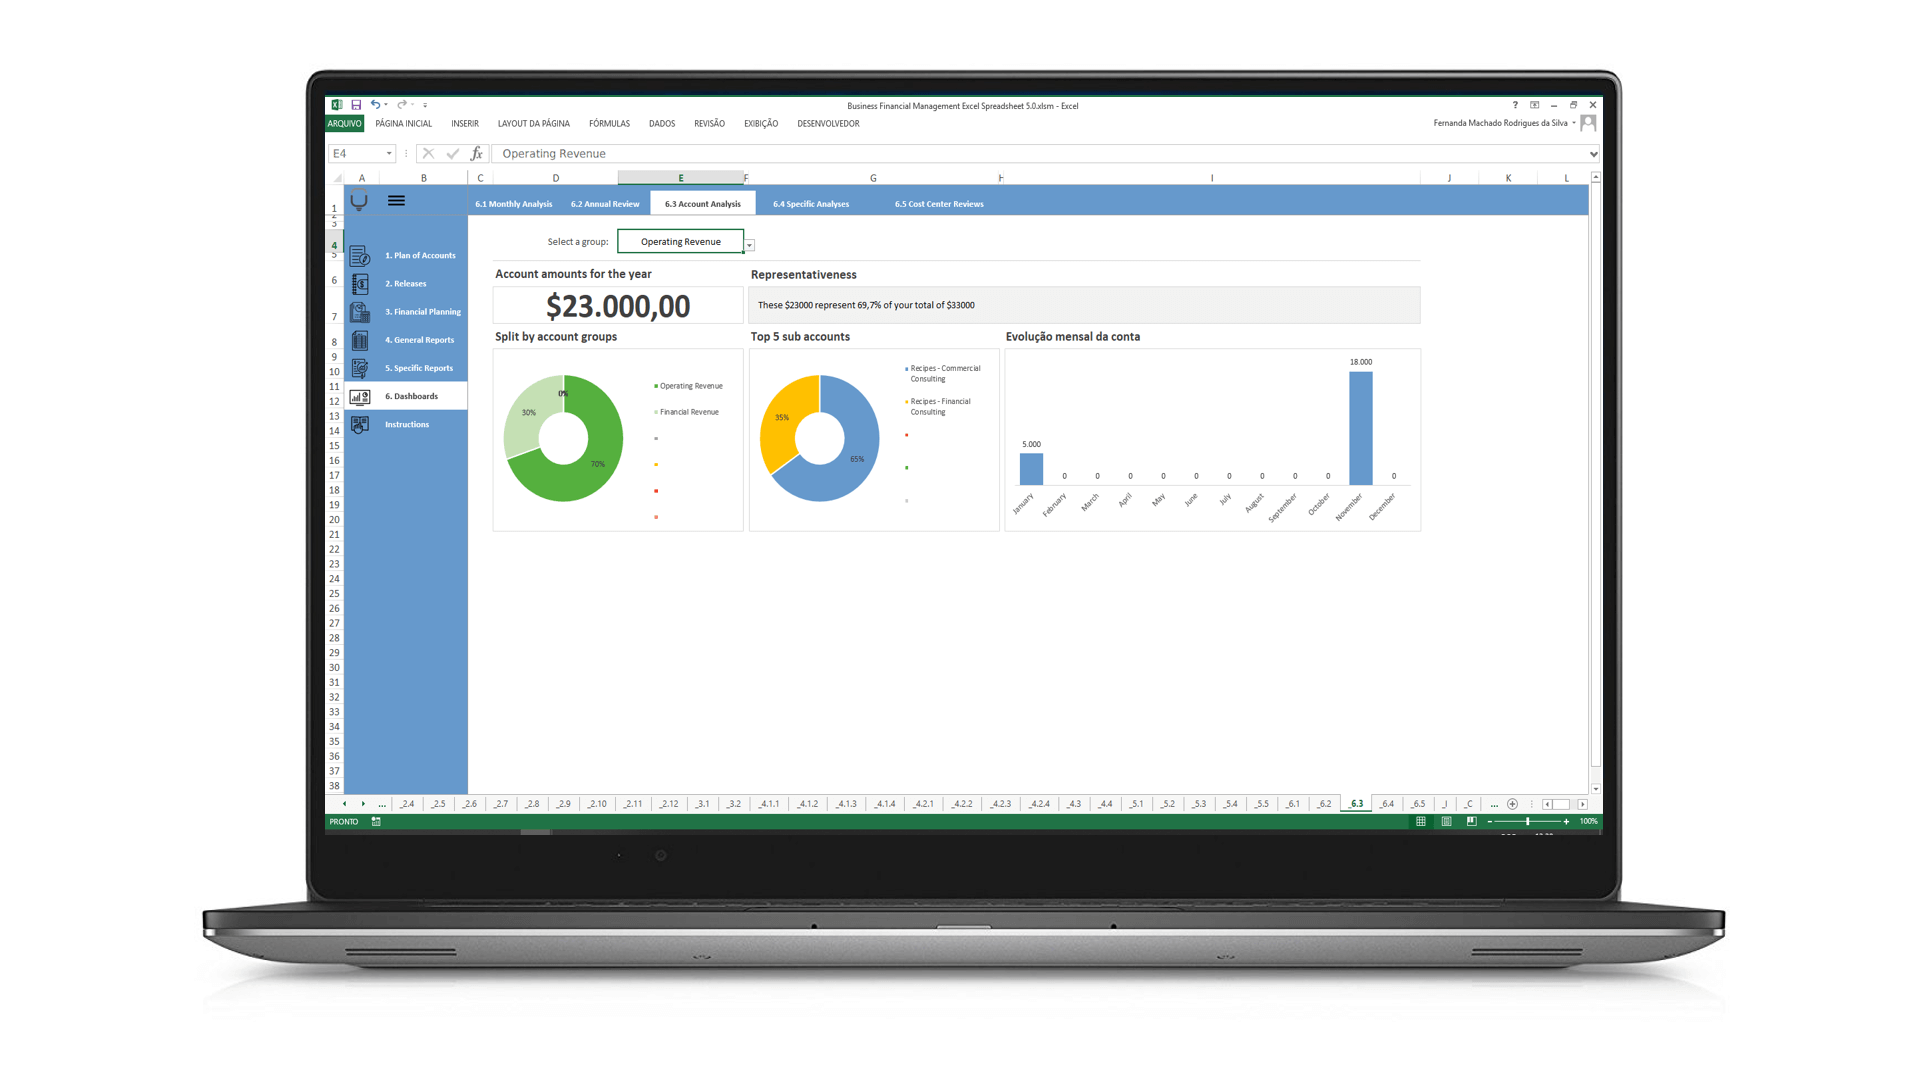
Account Analysis Dashboard
Here you will choose an account chart group and you will see various comparative information and charts in relation to the other income or expense accounts.
Cost Center Analysis Dashboard
Choose a cost center and a month to see the key metrics listed at the time.
Business Financial Management Excel Spreadsheet Template